Semiconductor stocks are a favorite among tech investors. These companies generally tend to have steady businesses and reasonable valuations.
Of course, a few names can command hefty premiums, but that’s not unusual in the market.
Lately, though, this group has taken the brunt of the selloff.
Perhaps it’s because investors consider them too cyclical and foresee a coming recession. Maybe investors tend to lump these names in with the growth stocks, which have been the worst performers amid the recent bear market.
Whatever the reason, semiconductor stocks have traded poorly. But now many of them have gotten quite cheap as they hit support areas on the charts.
Trading Semiconductor Stocks

Chart courtesy of TrendSpider.com
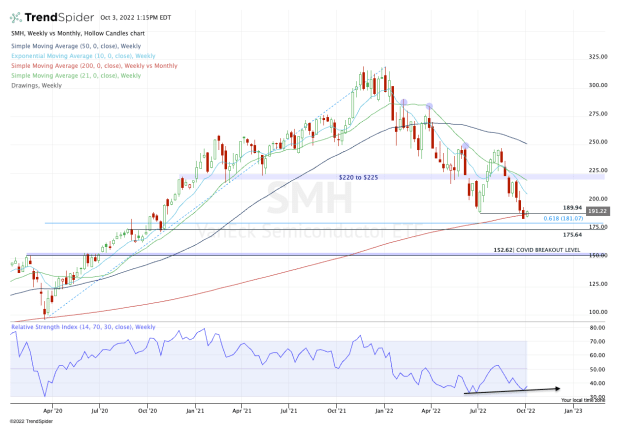
Last week, the VanEck Semiconductor ETF (SMH) closed at its low, while also closing below the prior 2022 low near $190 and below the 200-week moving average.
It was not a good look, but now the stock is bouncing and reclaiming these areas. That has us looking for a potential higher bounce -- while the lines in the sand are also clear.
If SMH can stay above $190, it keeps $200-plus in play. Above $200 puts the declining 10-week moving average on the table. Then comes active resistance via the 21-week moving average and the $220 to $225 area, which was support in 2021 and the first half of 2022.
On the downside, if SMH loses the $190 area and the 200-week moving average, it’s vulnerable to a retest of this year’s low at $185.11. Below that and perhaps it tests the 61.8% retracement near $181, then the 2020 breakout level near $175.
Advanced Micro Devices

Chart courtesy of TrendSpider.com
Advanced Micro Devices (AMD) and Nvidia (NVDA) are two of investors’ favorite semiconductor stocks.
Still, they haven’t traded all that well.
Nvidia’s business is feeling pressure, as it preannounced worse-than-expected results and then delivered disappointing guidance a few weeks later. Conversely, AMD delivered a top- and bottom-line beat and guidance that was slightly disappointing but still impressive.
As we look at AMD, the shares broke below the 200-week moving average, but are so far holding the 78.6% retracement and the monthly VWAP measure.
If we get a bounce, look for a test of the 200-week moving average and the $72 to $74 area. Above the 10-week moving average could put the mid-$80s in play.
On the downside, continued selling pressure could put the big $60 breakout area back in play.


