Tilray, Inc (NASDAQ:TLRY) was trading over 6% higher on Tuesday as the stock attempted to break up bullishly from an inside bar pattern that developed on Friday and Monday on the daily chart. Tilray's recent move higher comes after rumors that the Marijuana Opportunity, Reinvestment and Expungement (MORE) Act could end up on the House floor this week.
An inside bar pattern indicates a period of consolidation and is usually followed by a continuation move in the direction of the current trend.
An inside bar pattern has more validity on larger time frames (four-hour chart or larger). The pattern has a minimum of two candlesticks and consists of a mother bar (the first candlestick in the pattern) followed by one or more subsequent candles. The subsequent candle(s) must be completely inside the range of the mother bar, and each is called an "inside bar."
Want direct analysis? Find me in the BZ Pro lounge! Click here for a free trial.
A double, or triple inside bar can be more powerful than a single inside bar. After the break of an inside bar pattern, traders want to watch for high volume for confirmation the pattern was recognized.
- Bullish traders will want to search for inside bar patterns on stocks that are in an uptrend. Some traders may take a position during the inside bar prior to the break, while other aggressive traders will take a position after the break of the pattern.
- For bearish traders, finding an inside bar pattern on a stock that's in a downtrend will be key. Like bullish traders, bears have two options of where to take a position to play the break of the pattern. For bearish traders, the pattern is invalidated if the stock rises above the highest range of the mother candle.
See Also: Simon Says Legalize: Tilray CEO Makes The Case For Cannabis
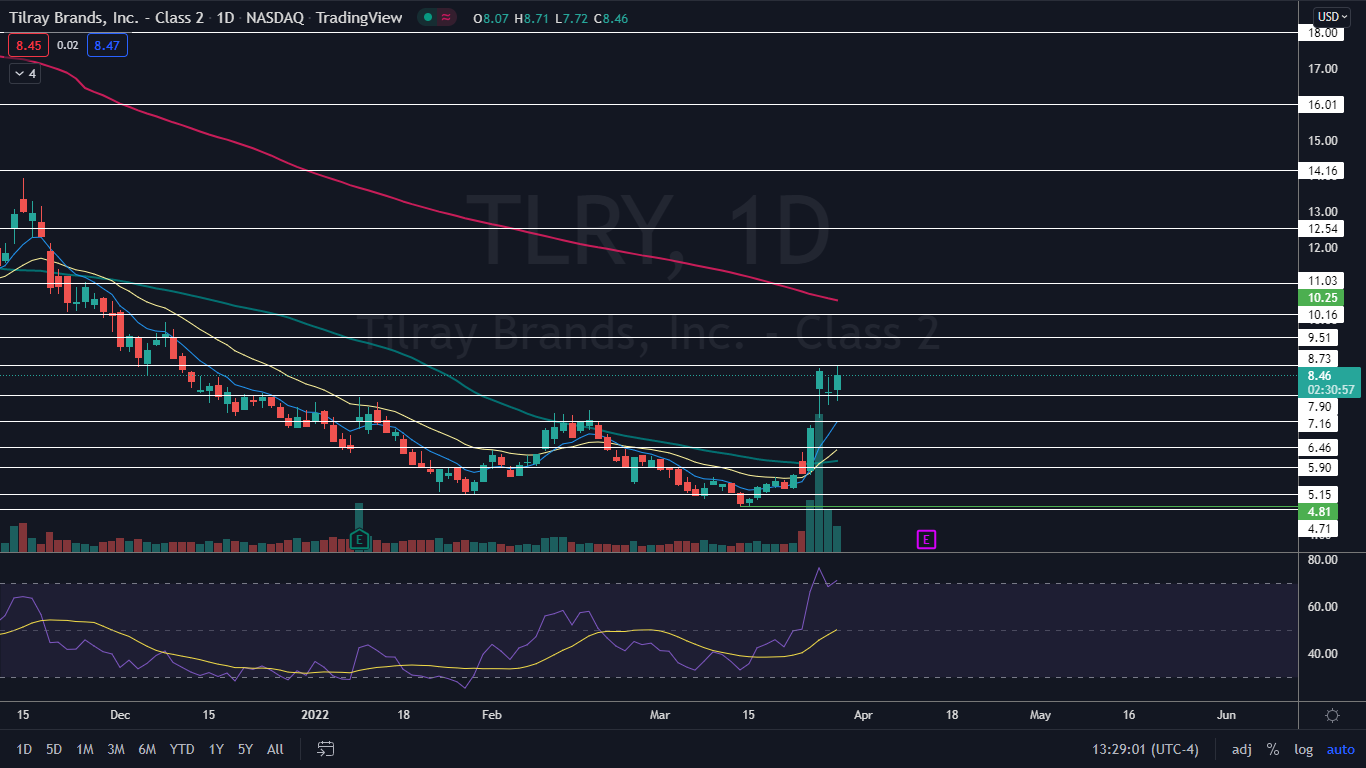
The Tilray Chart: Tilray reversed course into an uptrend on March 15 after forming a bullish double bottom pattern on that day and the day prior at the $4.81 level. Between March 22 and March 25, when Tilray confirmed the uptrend by forming a higher high, the stock soared over 61% higher and has since been consolidating sideways.
- The consolidation on Monday settled Tilray into an inside bar pattern, with all of the daily price action taking place within Friday’s range. The inside bar leans bullish because the stock was trading higher before printing the pattern. Traders can watch for the stock to break up above the $8.73 level on higher-than-average volume to gauge whether the pattern has been recognized.
- If Tilray doesn’t break up from the inside bar pattern, the stock may form into a bull flag pattern on the daily chart, with the pole formed between March 24 and March 25 and the flag printing over the days that have and will follow. Continued consolidation within a flag formation would help to cool Tilray’s relative strength index, which is currently in overbought territory at about the 72% level.
- If a bull flag pattern is created and recognized, the measured move is about 48%, which indicates Tilray could trade up toward the $12 mark.
- Tilray has resistance above at $8.73 and $9.51 and support below at $7.90 and $7.16.