Silver’s recent strength is attracting attention, with investors and analysts debating whether the metal is primed for a sustained period of outperformance. Three charts – the gold-to-silver ratio, silver's relative value against the S&P 500, and a major long-term technical breakout – offer evidence that silver may be entering a new bull phase.
The gold-to-silver ratio, which measures how many ounces of silver are needed to equal one ounce of gold, is one of the oldest continuously tracked relationships in markets.

Gold-to-silver ratio (weekly), Source: TradingView
A high ratio shows that silver might be undervalued relative to gold, while a low ratio suggests the opposite. Natural resource investors who monitor this ratio tend to shift their exposure from gold to silver when it is high, and rotate back to gold when it is low.
Also Read: Silver’s Outperformance Marks The Next Commodity Bull Phase
For this purpose, they typically use specialized ETFs like SPDR Gold Shares (NYSE:GLD) and iShares Silver Trust (NYSE:SLV).
The latest levels, around 86.4, are well above the long-term average, closer to 50–60, pointing to significant potential for silver to narrow the gap if momentum continues.
A second lens on silver's potential comes from its ratio to the S&P 500. This metric shows how silver performs against the benchmark of U.S. equities.
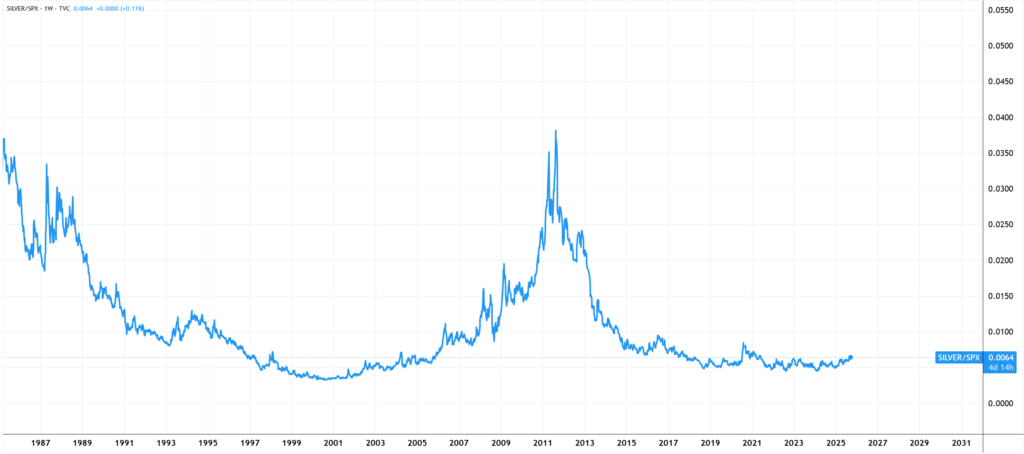
Silver-to-S&P 500 ratio (weekly), Source: TradingView
Crescent Capital's Macro Strategist Tavi Costa pointed to this ratio in a LinkedIn post.
"By the end of this decade, I believe traditional portfolios will likely hold a meaningfully larger allocation to hard assets than they do today," he said.
During the last major silver bull market from 2008 to 2011, the ratio bottomed before surging higher as silver prices dramatically outpaced stocks. Today, the ratio is again at historic lows, suggesting silver is historically cheap relative to equities. If the pattern rhymes with the last cycle, silver could be on the verge of another period where it materially outperforms financial assets.
Finally, silver's recent bullish move has completed a generational breakout. The metal has completed a long-term cup-and-handle pattern that spans more than four decades, marked by peaks in the early 1980s and 2011. After years of consolidation, the metal broke through key resistance around $30–$32 per ounce.
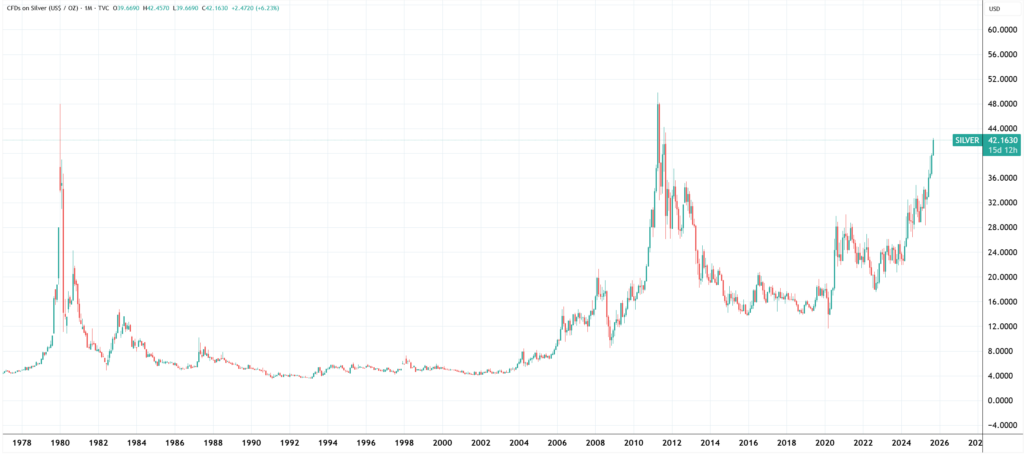
Silver price (1-month), Source: Tradingview
Per technical analysis, adding the height of the pattern to the breakout zone suggests an upside target of around $75. Although considerable, this number is still well below triple digits as some investors have recently suggested.
Beyond its role as a store of value, silver plays a big part in the manufacturing of solar panels, semiconductors, and batteries – all essential in the global decarbonization effort. Yet, persistent supply deficits offer a compelling case for the continuation of bullish momentum.
Read Next:
Photo by Olivier Le Moal via Shutterstock