/Nvidia%20logo%20and%20sign%20on%20headquarters%20by%20Michael%20Vi%20via%20Shutterstock.jpg)
Nvidia (NVDA) is a great company and a true generational leader in the stock market. Some call it untouchable, while others are quick to remind us that there’s no such thing as a “one-decision stock.”
That is, stocks you can buy and not even consider selling. Not that it can’t work out, but if it doesn’t, you could be left wallowing in regret.
So enough crying about possibly crying, let’s look at where NVDA is now. Because there’s one particular indicator I track closely for stocks and ETFs, and it is just about to break down. If it does, it could usher in a rough period for the overall stock market.
And it could send NVDA owners running for the hills… or, for an option collar if they are ready, willing and able. More on that below.
NVDA’s daily and weekly charts are not encouraging to me. Here’s the daily. That red line rolling over at the top is the 20-day moving average. It has not flashed this type of danger signal since it was at $140 in March. That was right before the chaos of “Liberation Day” which dropped the stock to under $90 a share, only to see it fly again, doubling in a matter of months. That’s 2025 in a nutshell. A multitrillion-dollar market cap stock, moving like that!
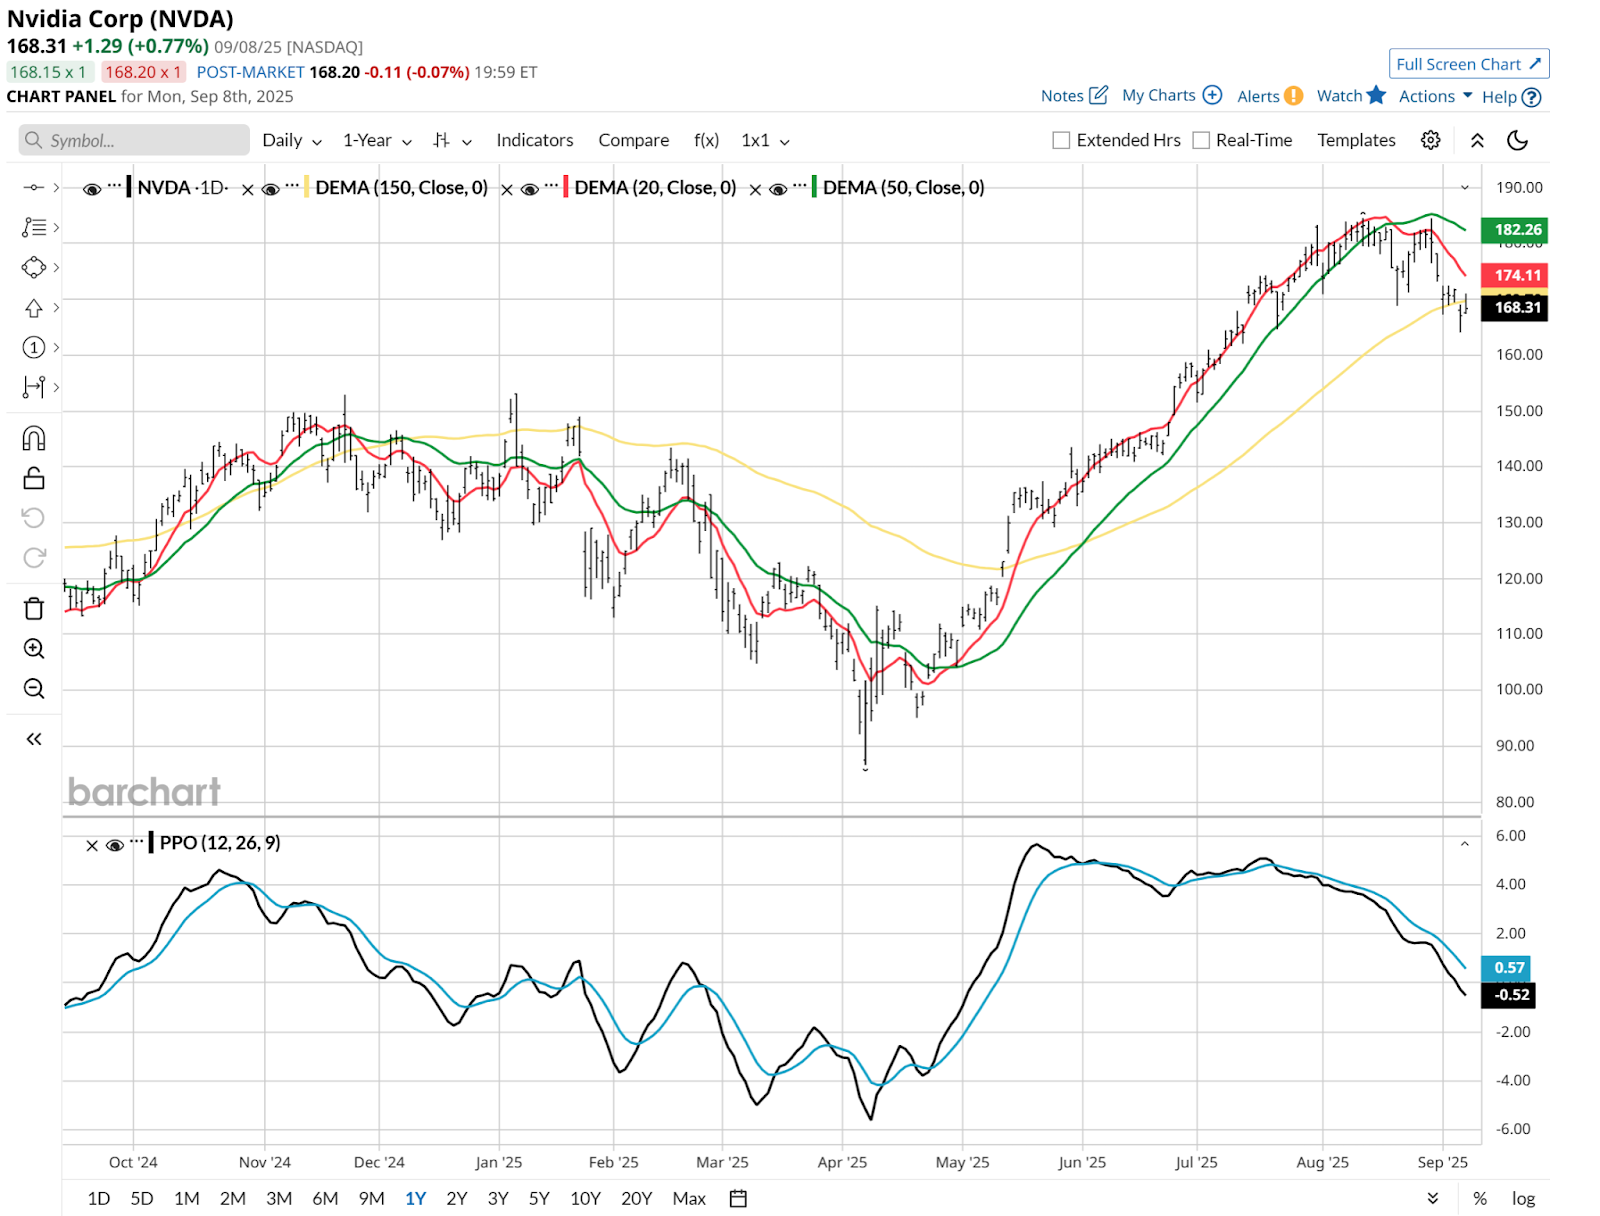
The PPO in the lower end of the chart is rolling over, and doing so persistently. That could indicate that this dip, currently less than 10%, could break into double digits soon.
The weekly chart (below) doesn’t provide much of a lift for NVDA holders. While the 20-week moving average is still in “neutral,” not having rolled over yet, the PPO is right on the line between crossing lower and yet another “saved by the bell” moment.
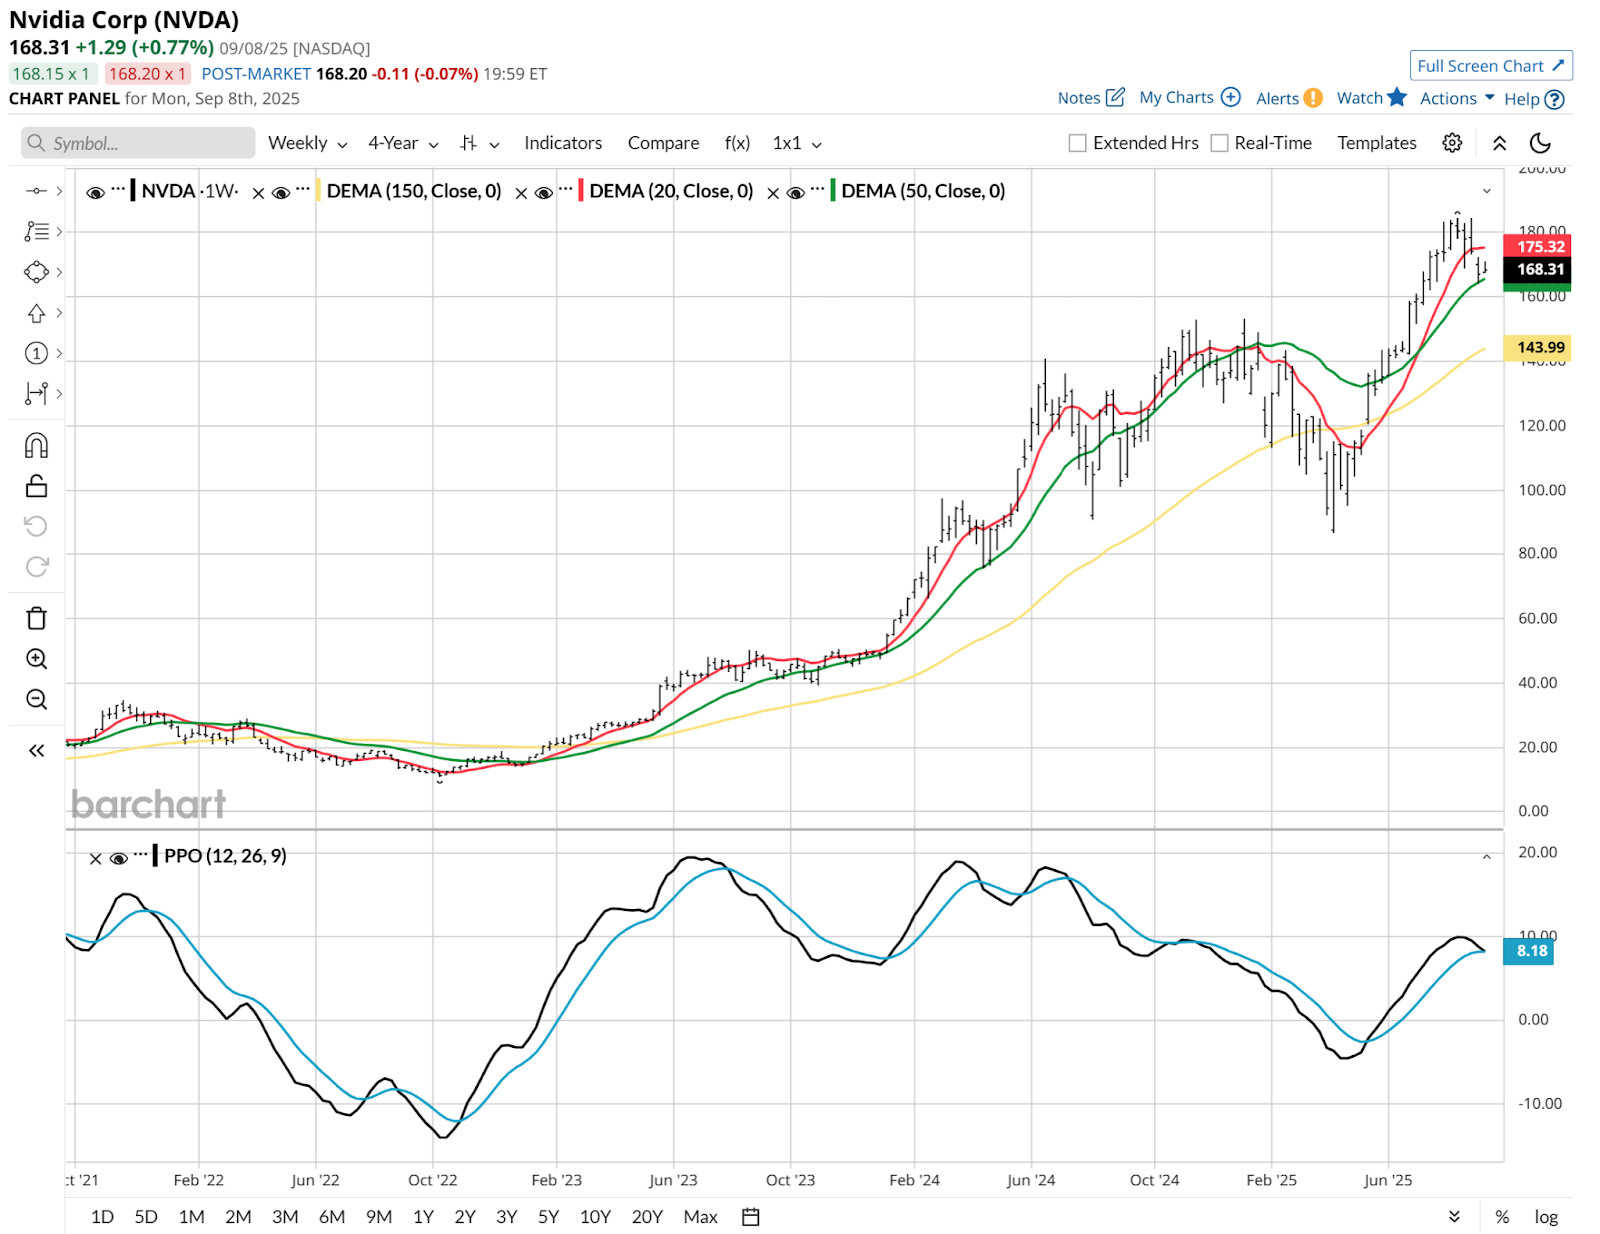
This doesn’t mean the stock crashes, or even dips much more. NVDA is like the cat of the stock market, with at least nine lives and counting. It might be experiencing a wall of worry this month, but it could also have a wall of buyers ready to pounce on every dip. Still, I play the odds. And the more likely direction is down.
Who Are You Calling Calm?
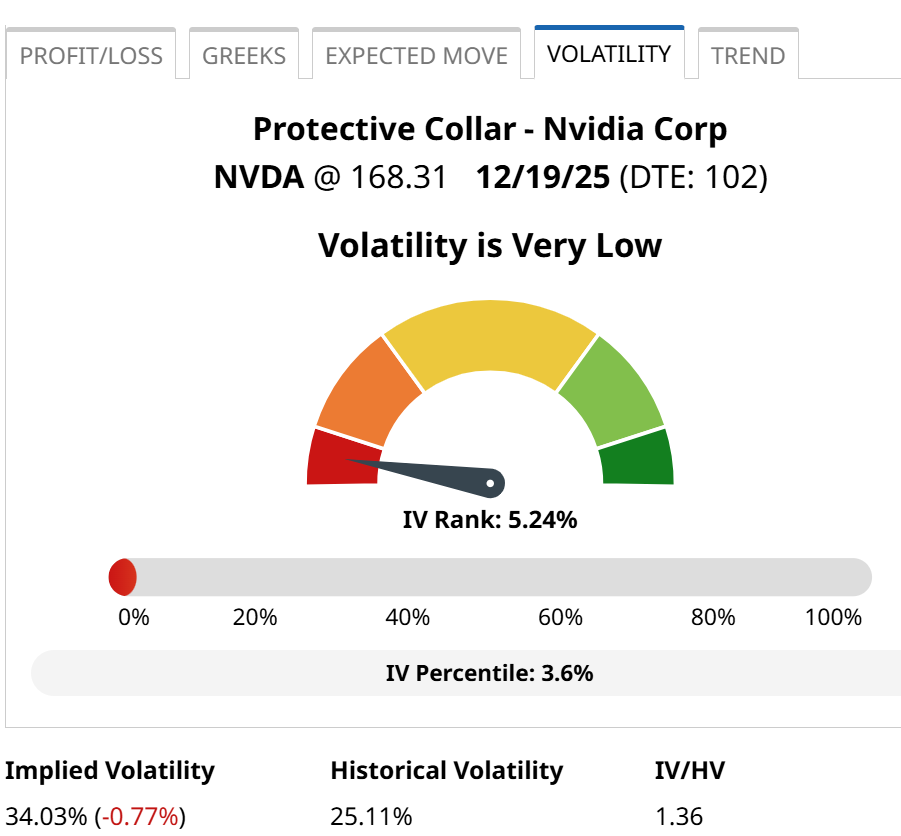
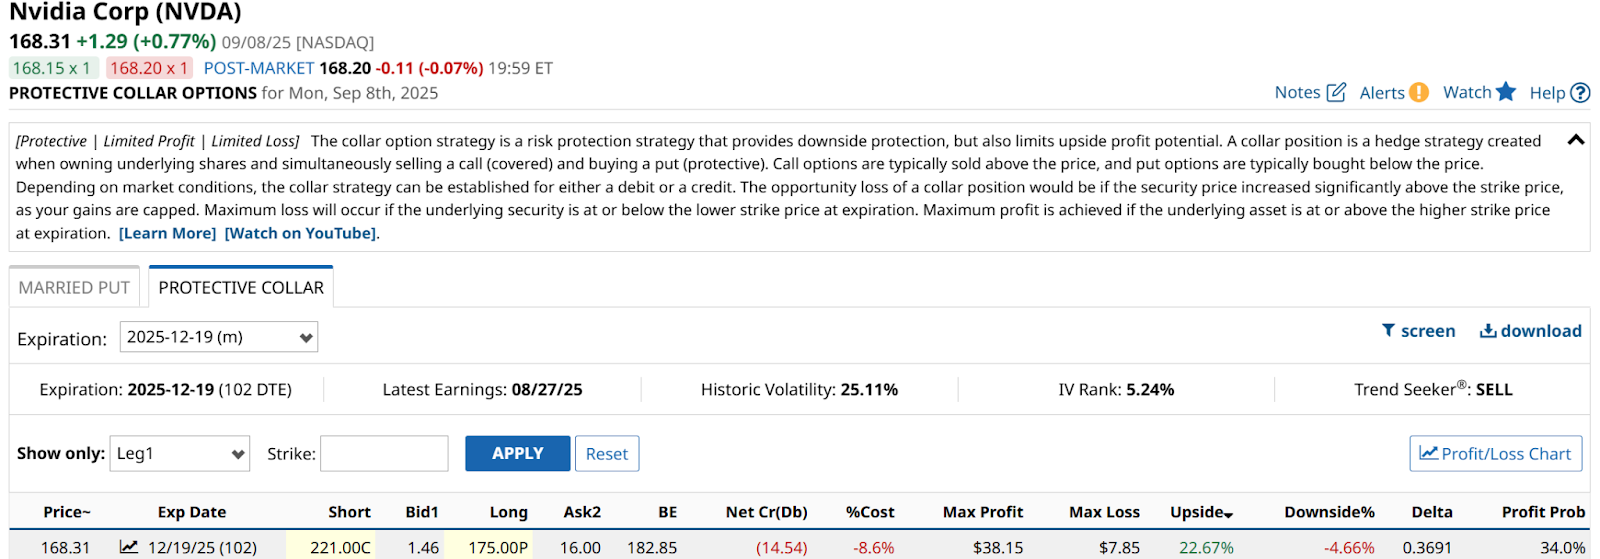
NVDA is typically a good collar candidate, since it is so volatile. Check out that Historic Volatility and IV Rank combination below. The latter indicates that the stock is nearly in the bottom 5% of its 12-month rolling volatility. In other words, it has been unusually calm recently.
What does “calm” mean for NVDA? Only an implied volatility of 34! That’s more than double the S&P 500 Index ($SPX) right now. For option sellers in particular, this is a good thing, since that allows us to gather more covered call premium to pay for the put purchase, which is the other side of the collar.
This sample below results in a $221 to $175 collar range, or about 22% upside to less than 5% downside over the next 3 months. I’d pay up a bit for it (cost is 8.6%), but personally when I collar stocks and ETFs, I do so with the idea that a few percentage points either way is par for the course. Especially with a volatile stock like NVDA.
Watch those red flags. And remember that options are always, well, an option at times like this. Barchart’s tool set in that regard is invaluable for traders like me.