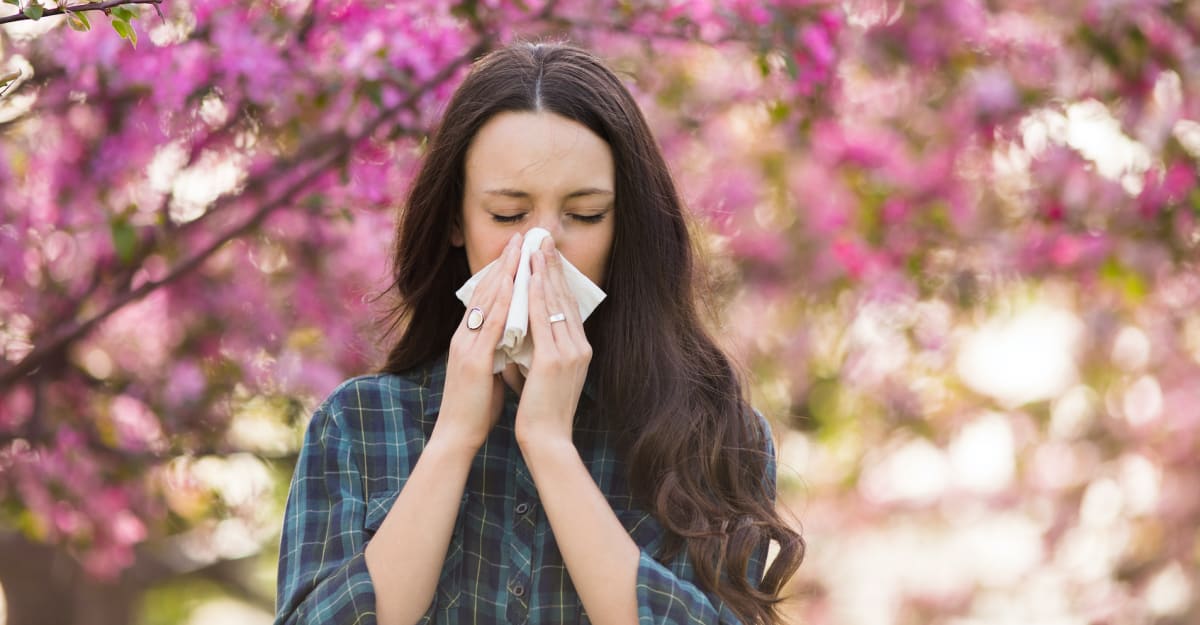
Bless you. Gesundheit. Salud. It’s spring, and that means allergy season. If you’re a tree, grass, or weed, it’s a big fun time to bloom and spread your pollen on the wind. But it’s no fun for the 25.7% of American adults and 18.9% of kids who have seasonal allergies.
Sneezing, stuffy, itchy, runny nose, and itchy, watery eyes are the common symptoms of hay fever and are usually caused by allergic sensitivity to pollens from trees, grasses or weeds, or to airborne mold spores, according to the American College of Allergy, Asthma & Immunology.
But for some people, this same reaction can also affect the lungs and airways, leading to asthma symptoms. Asthma can go quickly from bad to worse, and it can be life-threatening if a person cannot get enough oxygen.
According to the Asthma and Allergy Foundation of America, allergens are the most common asthma trigger, and more people suffer asthma emergencies during the times when pollen counts are highest.
Those times are usually spring, but not just. Trees produce pollen early in the spring, followed by grass pollen from around April to June, according to the AAFA, and many plant produce it into the fall.
As for weeds, ragweed pollen is the worst offender when it comes to allergies, according to the AAFA. About 15% of people in the U.S. are allergic to ragweed. It grows everywhere in the U.S. except Alaska, but mostly in the Midwest and eastern states.
The places where the burden of allergies tends to be greatest is in the eastern and southern parts of the country, according to a recent report by the AAFA, which ranked 100 U.S. cities based on pollen counts and allergy management.
To determine the best and worst cities for living with allergies, the Asthma and Allergy Foundation of America analyzed data from the 100 most-populated metropolitan statistical areas in the lower 48 states (Alaska and Hawaii were not included because they are often not included in national pollen monitoring systems.)
In the report, 2023 Allergy Capitals: The Most Challenging Places to Live with Allergies, researchers scored each metro based on five factors: pollen scores for tree, grass, and weed pollen, over-the-counter allergy medication use according to the IRI Medication Sales Database, and the number of of board-certified allergists and immunologists per patient in each city.
The pollen data for 2022 was collected from Pollen Sense, an automated sensor network that provides live pollen and mold counts. Days with “very high” pollen counts had a higher weight than “high” days for calculation of pollen scores.
The Centers for Disease Control and Prevention says that as climate change leads to shifts in precipitation patterns, more frost-free days, warmer seasonal air temperatures, and more carbon dioxide in the atmosphere, the length and timing of pollen seasons changes.
A warmer climate and longer growing season might explain why seven of the 20 worst allergy cities the AAFA’s report are in Florida.
The allergy season in Florida is pretty much all year. Because of Florida’s mild weather, some plants continue to grow and pollinate throughout the winter, making it one of the worse states for those with allergies.
And don’t think you can escape allergies by being in the city. Many of the health impacts of climate change are felt more in urban centers because of an effect called an “urban heat island” in which buildings, roads, infrastructure, population density, and a lack of green space can make cities several degrees warmer than nearby more rural areas, the AAFA says in its report. Climate change is expected to intensify the UHI effect, the report says.
Based on the ranking by the AAFA, these are the 30 worst cities for people who suffer allergies.

1. Wichita, Kan.
Tree, grass & weed pollen score: 100/100
- All pollen: Worse than average
- Use of over-the-counter allergy medicine: Worse than average
- Availability of allergy specialists: Worse than average
Wichita has the highest score of all 100 cities, and thus the worst ranking, making it the allergy capital of America. According to the report, in 2022, grass pollen levels in Wichita peaked in February and remained in the “high” or“very high” levels steadily through June. It is ranked the worst for all three pollen types-- trees, grass and weeds-- by the AAFA.

2. Dallas
Tree, grass & weed pollen score: 87.26
- All pollen: Worse than average
- Use of over-the-counter allergy medicine: Worse than average
- Availability of allergy specialists: Average

3. Scranton, Pa.
Tree, grass & weed pollen score: 87.08
- All pollen: Average
- Use of over-the-counter allergy medicine: Worse than average
- Availability of allergy specialists: Worse than average
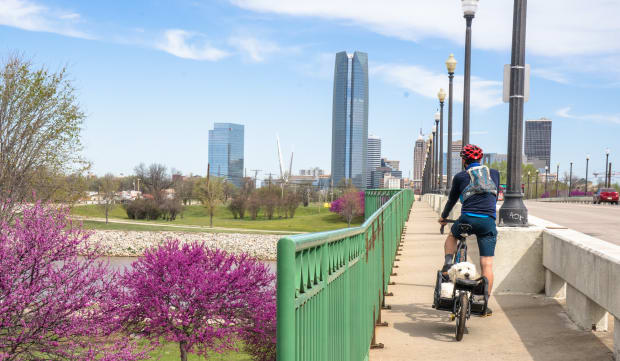
4. Oklahoma City
Tree, grass & weed pollen score: 86.69
- All pollen: Worse than average
- Use of over-the-counter allergy medicine: Worse than average
- Availability of allergy specialists: Average

5. Tulsa, Okla.
Tree, grass & weed pollen score: 86.05
- All pollen: Worse than average
- Use of over-the-counter allergy medicine: Worse than average
- Availability of allergy specialists: Average
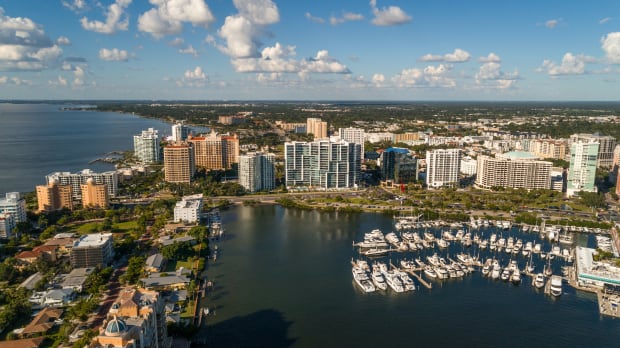
6. Sarasota, Fla.
Tree, grass & weed pollen score: 84.17
- All pollen: Worse than average
- Use of over-the-counter allergy medicine: Worse than average
- Availability of allergy specialists: Average
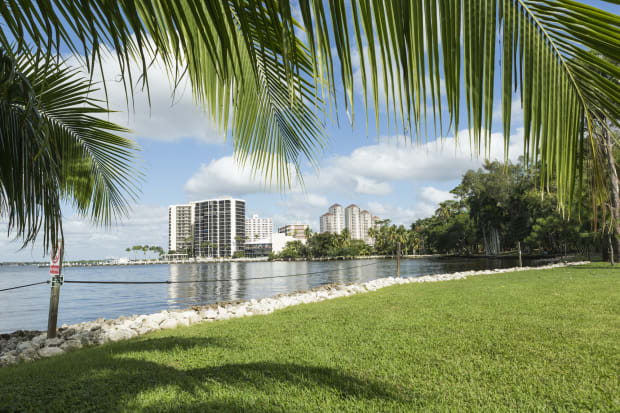
7. Cape Coral, Fla.
Tree, grass & weed pollen score: 81.32
- All pollen: Worse than average
- Use of over-the-counter allergy medicine: Worse than average
- Availability of allergy specialists: Average

8. Orlando, Fla.
Tree, grass & weed pollen score: 81.12
- All pollen: Average
- Use of over-the-counter allergy medicine: Worse than average
- Availability of allergy specialists: Average
elisfkc from Orlando, FL, US/Wikipedia
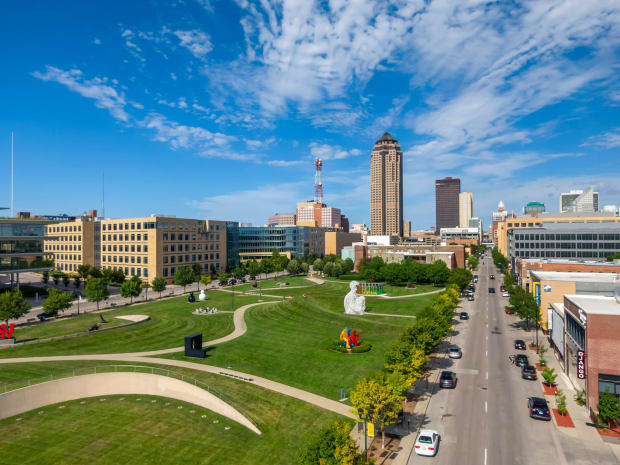
9. Des Moines, Iowa
Tree, grass & weed pollen score: 80.76
- All pollen: Average
- Use of over-the-counter allergy medicine: Average
- Availability of allergy specialists: Worse than average
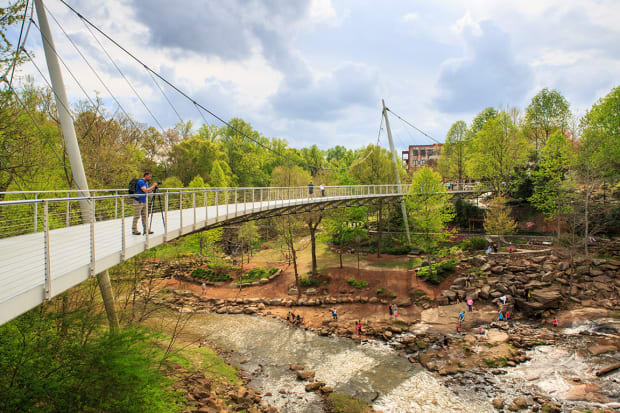
10. Greenville, S.C.
Tree, grass & weed pollen score: 79.43
- All pollen: Average
- Use of over-the-counter allergy medicine: Worse than average
- Availability of allergy specialists: Average
Cvandyke/Shutterstock
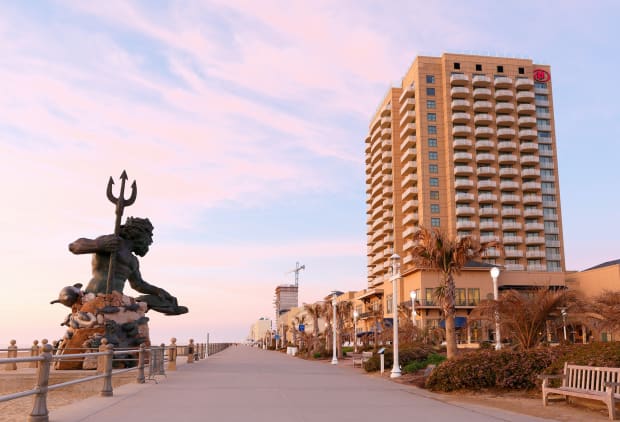
11. Virginia Beach, Va.
Tree, grass & weed pollen score: 78.35
- All pollen: Average
- Use of over-the-counter allergy medicine: Worse than average
- Availability of allergy specialists: Average
Jay Yuan / Shutterstock
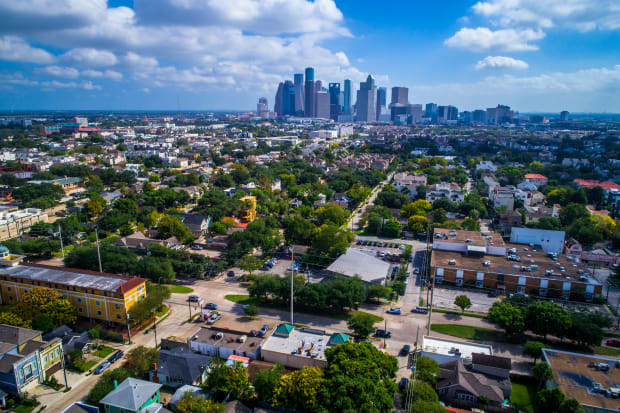
12. Houston
Tree, grass & weed pollen score: 78.33
- All pollen: Worse than average
- Use of over-the-counter allergy medicine: Average
- Availability of allergy specialists: Average

13. Little Rock, Ark.
Tree, grass & weed pollen score: 77.90
- All pollen: Worse than average
- Use of over-the-counter allergy medicine: Worse than average
- Availability of allergy specialists: better than average
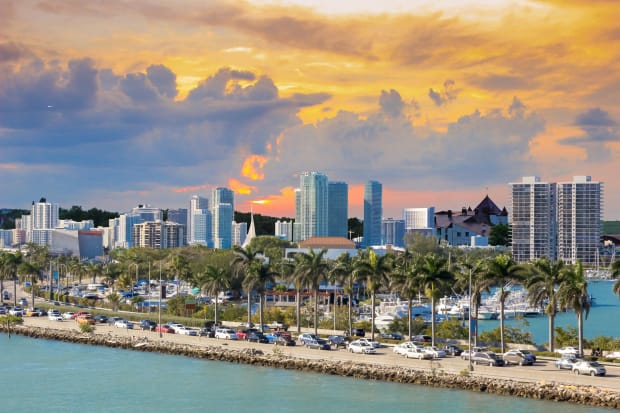
14. Miami
Tree, grass & weed pollen score: 77.64
- All pollen: Worse than average
- Use of over-the-counter allergy medicine: Average
- Availability of allergy specialists: Average
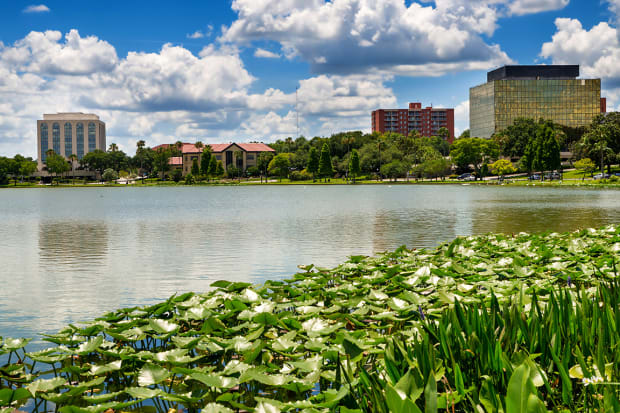
15. Lakeland, Fla.
Tree, grass & weed pollen score: 77.49
- All pollen: Average
- Use of over-the-counter allergy medicine: Average
- Availability of allergy specialists: Worse than average
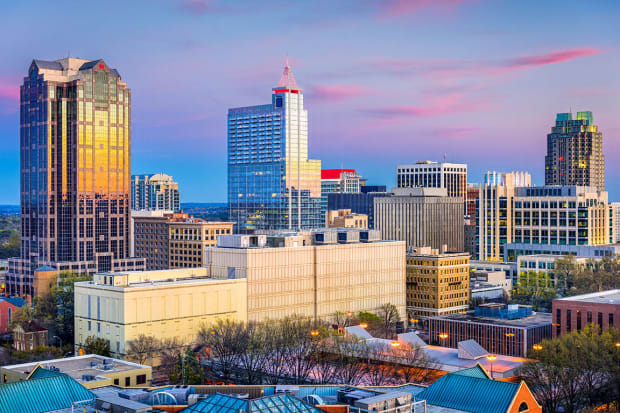
16. Raleigh, N.C.
Tree, grass & weed pollen score: 77.33
- All pollen: Average
- Use of over-the-counter allergy medicine: Worse than average
- Availability of allergy specialists: Worse than average
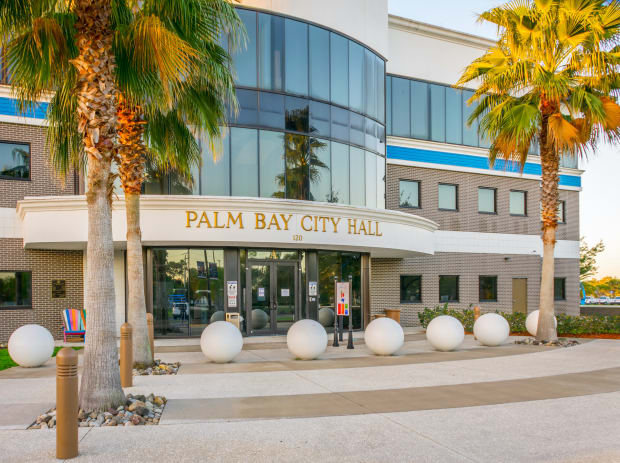
17. Palm Bay, Fla.
Tree, grass & weed pollen score: 77.06
- All pollen: Average
- Use of over-the-counter allergy medicine: Worse than average
- Availability of allergy specialists: Worse than average
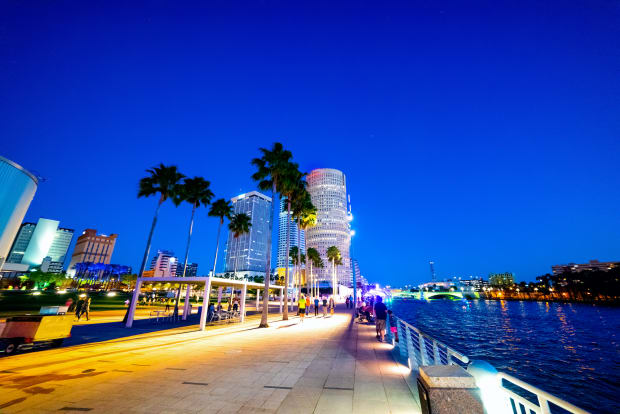
18. Tampa, Fla.
Tree, grass & weed pollen score: 77.02
- All pollen: Worse than average
- Use of over-the-counter allergy medicine: Worse than average
- Availability of allergy specialists: Average
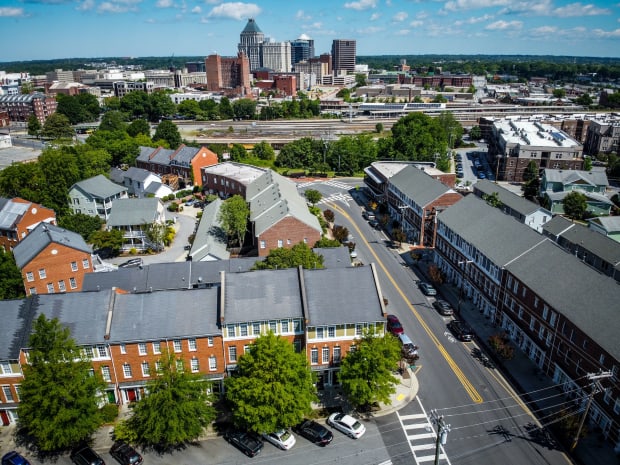
19. Greensboro, N.C.
Tree, grass & weed pollen score: 76.76
- All pollen: Average
- Use of over-the-counter allergy medicine: Worse than average
- Availability of allergy specialists: Worse than average
Shutterstock

20. Rochester, N.Y.
Tree, grass & weed pollen score: 76.74
- All pollen: Worse than average
- Use of over-the-counter allergy medicine: Average
- Availability of allergy specialists: Better than average
Shutterstock

21. Kansas City, Mo.
Tree, grass & weed pollen score: 76.38
- All pollen: Average
- Use of over-the-counter allergy medicine: Average
- Availability of allergy specialists: Average
22. New Orleans
Tree, grass & weed pollen score: 76.02
- All pollen: Worse than average
- Use of over-the-counter allergy medicine: Average
- Availability of allergy specialists: Better than average

23. Richmond, Va.
Tree, grass & weed pollen score: 75.79
- All pollen: Average
- Use of over-the-counter allergy medicine: Worse than average
- Availability of allergy specialists: Better than average
Shutterstock
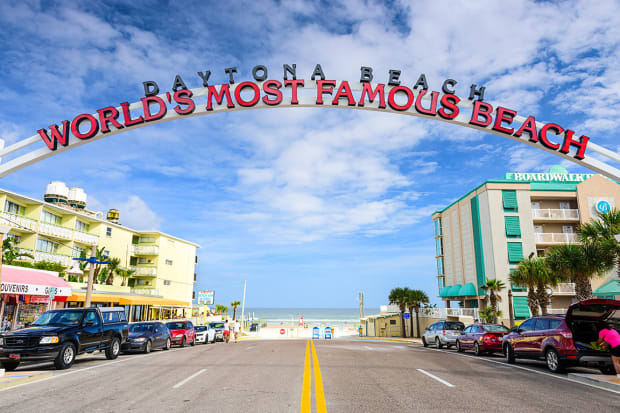
24. Daytona Beach, Fla.
Tree, grass & weed pollen score: 75.78
- All pollen: Average
- Use of over-the-counter allergy medicine: Worse than average
- Availability of allergy specialists: Average
Shutterstock
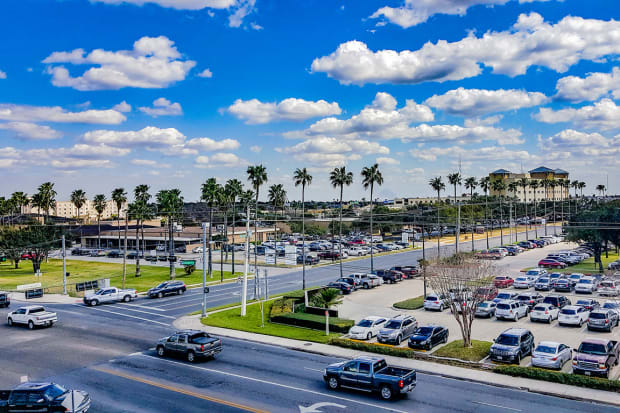
25. McAllen, Texas
Tree, grass & weed pollen score: 75.64
- All pollen: Worse than average
- Use of over-the-counter allergy medicine: Better than average
- Availability of allergy specialists: Average
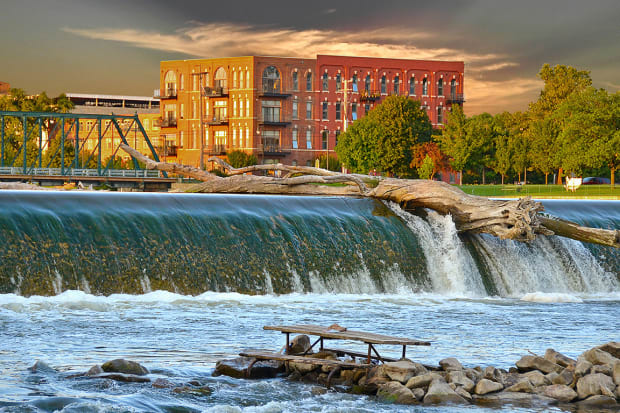
26. Grand Rapids, Mich.
Tree, grass & weed pollen score: 75.57
- All pollen: Worse than average
- Use of over-the-counter allergy medicine: Average
- Availability of allergy specialists: Average
Photo: Shutterstock
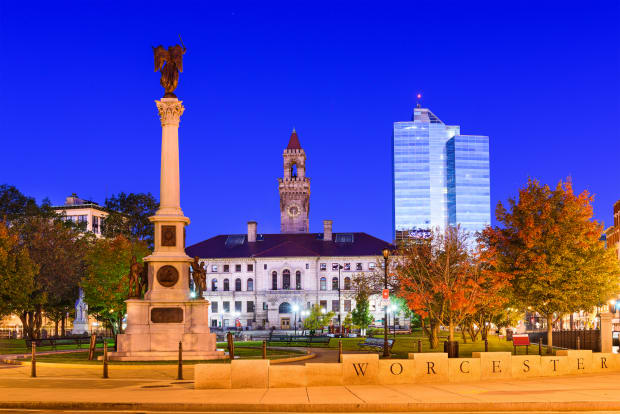
27. Worcester, Mass.
Tree, grass & weed pollen score: 75.46
- All pollen: Average
- Use of over-the-counter allergy medicine: Average
- Availability of allergy specialists: Worse than average

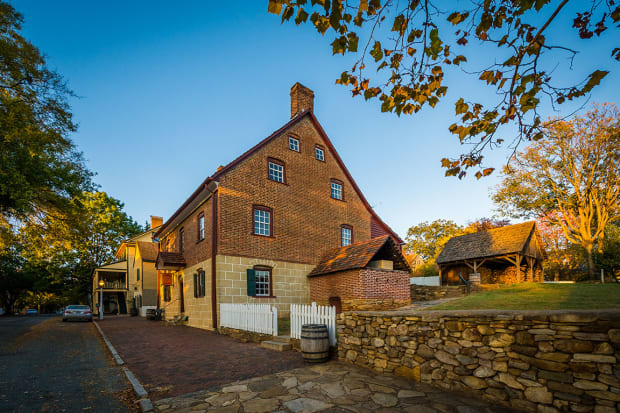
28. Allentown, Pa.
Tree, grass & weed pollen score: 75.46
- All pollen: Average
- Use of over-the-counter allergy medicine: Worse than average
- Availability of allergy specialists: Average
29. Winston-Salem, N.C.
Tree, grass & weed pollen score: 75.20
- All pollen: Average
- Use of over-the-counter allergy medicine: Worse than average
- Availability of allergy specialists: Average
Shutterstock
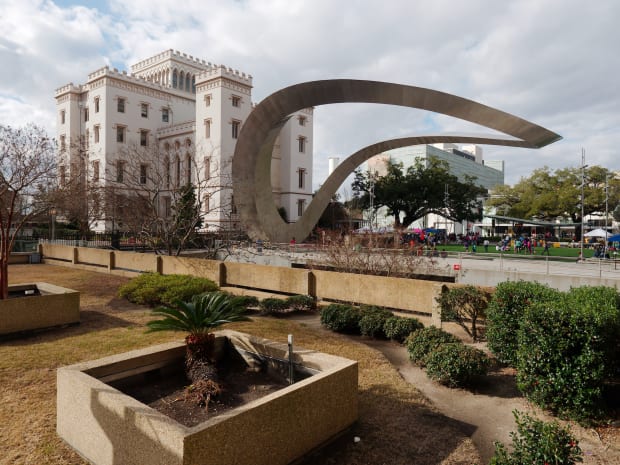
30. Baton Rouge, La.
Tree, grass & weed pollen score: 74.99
- All pollen: Worse than average
- Use of over-the-counter allergy medicine: Average
- Availability of allergy specialists: Average
Learn more about allergies at the Asthma and Allergy Foundation of America, and read their full report here.