
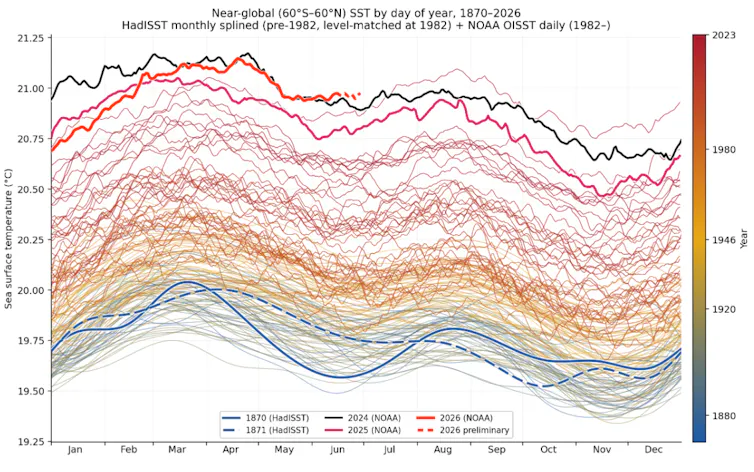
The world’s oceans are the hottest on record for June, pushing past records set during the 2023–24 El Niño years.
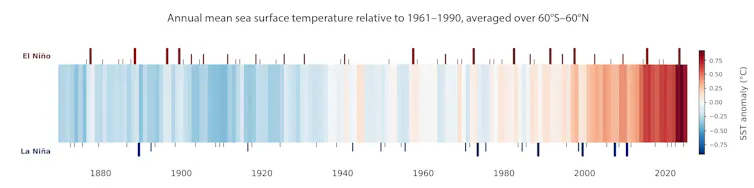
Right now, the average sea surface temperature is just under 21°C across the world’s tropical and temperate oceans. Before widespread industrialisation in 1870, the temperature was about 19.6°C.
That may not sound like a big difference. But heating the world’s oceans this much requires a truly enormous amount of energy. Of all the extra heat trapped by greenhouse gases from burning coal, gas and oil, more than 90% has gone into the world’s oceans.
As a result, the oceans are getting rapidly warmer. In 2025, the heat added was the equivalent of about 12 Hiroshima-scale nuclear bombs exploding every second of every day.
To find a climate analogue comparable to what’s happening now in the oceans, we would have to go back around 120,000 years to before the last ice age. Back then, slow shifts in Earth’s orbit led it to heat up gradually over thousands of years. Humans have accomplished a similar result in a little over a century.
But the heat in the ocean doesn’t just stay there. Hotter oceans fuel stronger cyclones, a more humid atmosphere, more intense rainfall and more heat in air masses over the seas, which can in turn make heatwaves over land more likely and more intense.
The El Niño forming in the tropical Pacific right now is likely to be a big one. As it develops, we can expect to see warmer temperatures and extreme events such as marine heatwaves in the western Indian, tropical Atlantic and eastern Pacific Oceans.
Where are the hotspots on land and in the ocean?
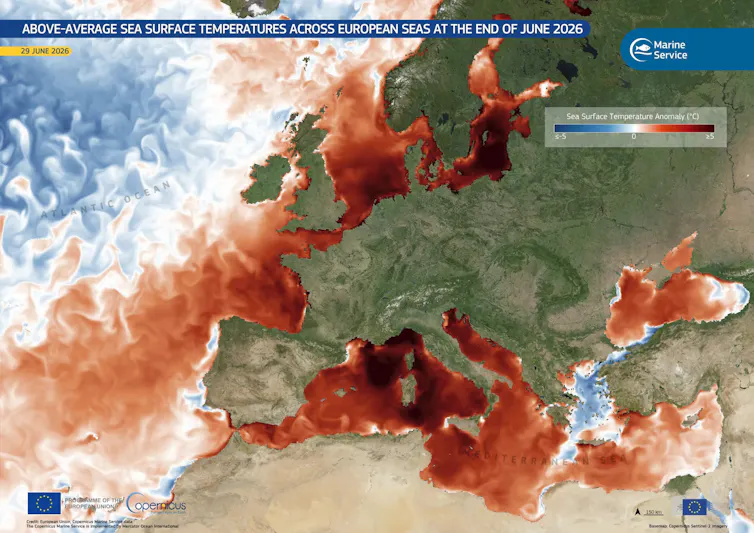
Europe is sweltering through a record-breaking heatwave. The oceans surrounding the region and in enclosed seas are also exceptionally hot.
Parts of the Mediterranean are up to 6°C hotter than the long-term average.
Parts of the North Sea are up to 3°C warmer than average.
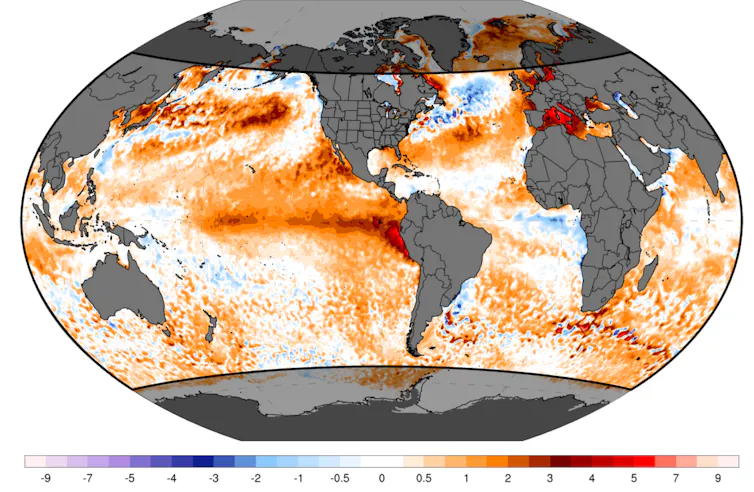
The forming El Niño has led to sea surface temperatures about 1.24°C warmer than average across a large area of the central eastern Pacific.
There’s much more heat below the surface as well. Subsurface conditions in the eastern Pacific are more than 6°C above average.
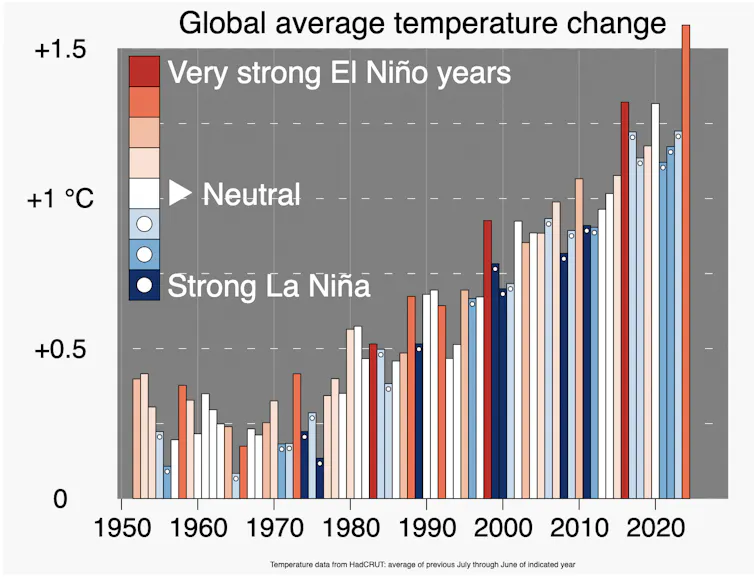
A typical El Niño lasts about a year. The full effect on atmospheric heat becomes clearest towards the end of the cycle. That means while we can expect 2026 to be very hot – perhaps a new record – next year is very likely to be even hotter, as ocean heat is moved back to the surface. We saw this during El Niño events over 2023–24 and 2015–16.
Steady ocean warming coupled with longer-lasting and more intense marine heatwaves pose huge threats to marine ecosystems such as coral reefs, sea grass meadows and coastal reefs. Research on the 2023–24 El Niño and the warm 2024 year showed widespread impacts.
From oceans to land
What happens in the oceans doesn’t stay there.
In June 2023, a record-breaking marine heatwave broke previous temperature records across the North Atlantic Ocean. Soon afterwards, large areas of Europe were hit by intense heatwaves, while extreme rains triggered deadly floods in Spain and severe bushfires broke out around the Mediterranean.
Rising ocean temperatures have many consequences.
A warmer ocean is less able to cool the land over summer. Warmer oceans also lead to more evaporation, boosting humidity and fuelling more intense and more sudden extreme rain and floods. These can have devastating consequences.
During El Niño events, there’s a clear geographical pattern. The regions we expect to be warmer or cooler during an El Niño roughly reflect where we are more or less likely to get marine heatwaves and more intense tropical cyclones.
Typical cyclone areas such as the western Indian Ocean could see stronger cyclones dumping heavier rainfall when they hit land. El Niño tends to bring extreme rain and floods to the western South America and dry conditions over parts of Australia and Southeast Asia.
Can we prepare?
We are gaining a better understanding of how big climate drivers like El Niño shape weather and how to use ocean data from around the world to develop better seasonal forecasts authorities can use to prepare.
Over the past two years, we have improved our ability to forecast marine heatwaves three to four months ahead in Australia, the United States and other regions. Forecasts give marine authorities a chance to act early by reducing allowable fishery catches and beginning conservation efforts for vulnerable species.
This early success in ocean forecasting may be short-lived. The current US administration last year slashed funding for climate data gathering networks and has worked to dismantle the National Center for Atmospheric Research.
This year, the administration announced it would end funding for a key ocean monitoring network before backing down.
Ongoing collection of ocean data is crucial for ocean and land forecasts. If they are weakened or discontinued, we could face the challenge of dealing with worsening climate impacts blind.
Ending the measuring of climate change won’t stop it happening. The only way to keep climate change from steadily worsening is to reach net zero as soon as humanly possible. Until then, we must use forecasts to prepare for what we can’t avoid.
This article was originally published on The Conversation. Read the original article.