
We hear a lot of things about the middle class, but many of us still aren’t really sure what it is. Sometimes, jobs and salaries in the middle class income bracket are the best they’ve ever been, Yet at the same time, you’ll hear it’s completely on the verge of disappearing, lumping everyone either in poverty or super wealthy.
In fact, most of the time, “experts” aren’t even really sure what it is exactly, often relying on a broad definition such as, “the social group between the upper and working classes …”
Fortunately, if you’re looking for a clearer answer as to whether or not you are part of the middle-class demographic, Pew Research has recently shared a handy calculator that help.
About the Data in the Middle Class Calculator
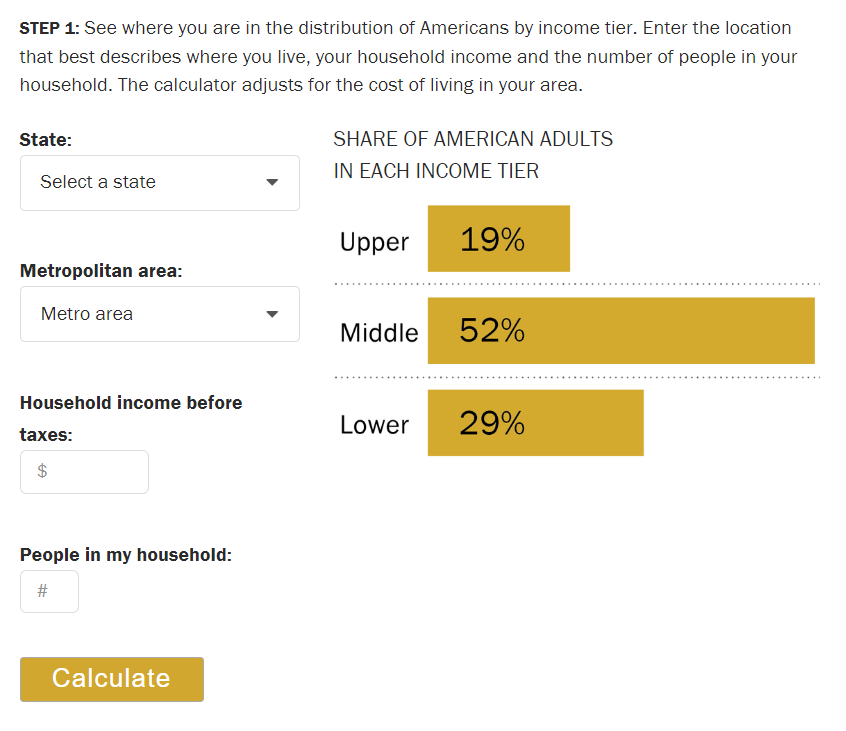
According to the Pew Research Center, in 2022, more than half of all adults lived in middle-income households. This leaves 29 percent in lower-income households and 19 percent in the upper income level.
So if you guessed that logically, middle class is in the middle, you’d be correct. However, it gets a little more complicated.
The data also allows you to find out which group you are in and compare it to other people in your area as well as all American adults. This is based on your education, age, race or ethnicity, and marital status. Because of all of these other factors, you might be middle class, but yet not quite in the middle.
How to Use the Calculator
To find out where your household falls in your area, you just need to enter the state you live in, the nearest metropolitan area, household income before taxes, and the number of people in your household. The calculator will show you which tier you are in, based on the calculation and the percentage of people in your area who are also in the same tier.
Next, you can enter your education, age, race or ethnicity, and marital status, to find out the percentage of people in your area who share those characteristics and the percentages of each in the lower, middle, and upper income tiers.
Try out the middle class calculator here.
Current Middle Class Income Analysis
According to the new analysis, middle class varies quite a bit depending on the metropolitan area you live in. For example, it’s 42 percent in San Jose, California and 66 percent in Tacoma, Washington. In lower income homes, it ranges from 16 percent in Bismark, North Dakota to 46 percent in Laredo, Texas.
And, as you might have guessed, the largest share of people living in upper-income homes is the highest in places like Santa Clara, California. (The lowest number of high-income homes is in Muskegon-Norton, Michigan at 8 percent.)
According to the US Census Bureau, the U.S. median household income was $77,719 in 2023. Fully 60.6% percent of people were employed full time and just 29% had a Bachelors Degree or higher (U.S. Census Bureau).
If you’re curious, try out the calculator. Note that the Pew Research does not store or share any of the information you enter into the calculator.
Do the numbers surprise you? Let us know your thoughts in the comments below.