When it comes to the narrative scaffolding undergirding the financial publication industry, the jig could be up — at least when it comes to the idea that fundamental and technical analysis (when applied correctly) can lead to huge profits. On the contrary, real edge is protected because it’s fragile, fleeting and destroyed the moment it’s widely known.
So, you’re in luck. The quantitative methodology that I’m about to share with you is unconventional and unique. More importantly, it builds a case based on available empirical data rather than assumptions about future volatility.
Every publicly traded security features a mathematical homeostatic state, the average trend over a given period of time. However, we know through GARCH (Generalized Autoregressive Conditional Heteroskedasticity) that the diffusion of volatility doesn’t occur in an independent and linear fashion but rather that it clusters — and is largely dependent on prior instances of volatility.
Stated differently, immediate catalysts have an exponentially greater impact on market behavior than catalysts that occurred some time in the past. This is common-sense stuff but it underscores an important point about the quantitative approach to the market, that different stimuli yield different results.
My thesis is that by juxtaposing the probabilistic distribution curve of the specific stimulus at hand against the parent dataset, we effectively create a bimodal distribution. Subsequently, if the specific population group for which we are targeting yields different results than what we would normally expect, we could potentially exploit this positive delta in our options trading strategies.
By using the options pricing data provided by Barchart Premier, we can determine which strategies make the most profitable sense.
Amgen (AMGN)
Under quantitative analysis, the core process revolves around the study of pricing behavior. In order to track such behaviors, though, it’s critical to standardize the language of price from a scalar signal to a discrete signal. To accomplish this, we’re going to compress pricing data into 10-unit blocks of up weeks and down weeks.
Let’s take a look at Amgen (AMGN). Under this framework, AMGN stock has printed in the trailing 10 weeks a 3-7-D sequence: three up weeks, seven down weeks, with an overall downward trajectory. The sequence itself isn’t important per se. Rather, it’s the statistical response to this pattern that is critical.
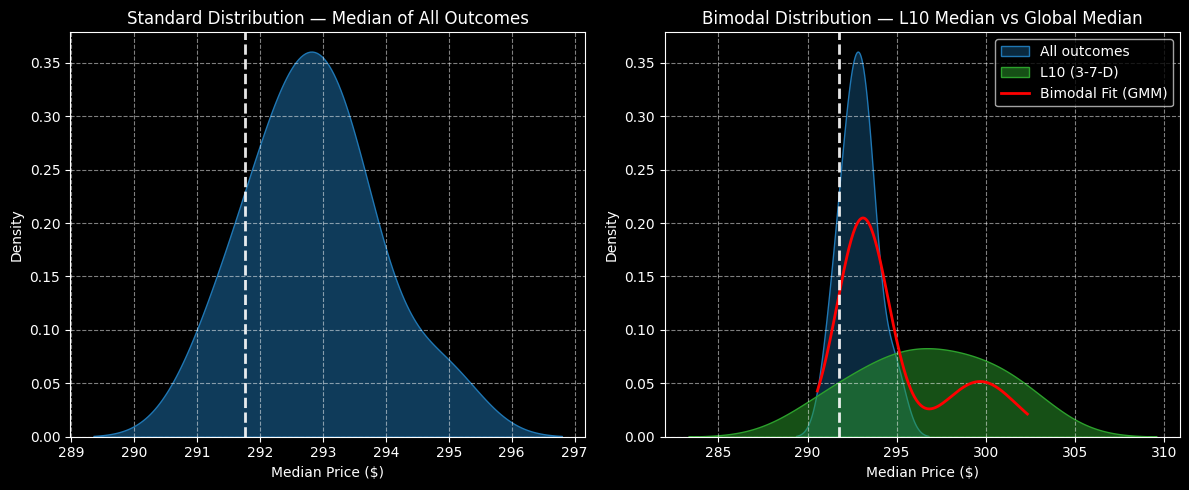
From past analogs, we can determine that under 3-7-D conditions, AMGN stock could be expected to range between $285 and $310, with price clustering occurring around $297 (assuming an anchor price of $291.76. When Amgen is in a homeostatic state, price clustering would be expected to occur at a little under $293.
On a terminal basis, AMGN stock would be expected to post a median price of close to $300 under 3-7-D conditions over the next four weeks. Further, at the fourth week, the exceedance ratio relative to the starting point would land at 65.5%.
Given the data above, the options trade that would seem to make the most sense is thew 290/300 bull call spread expiring Nov. 21.
Costco (COST)
Membership-only retailer Costco (COST) might not seem like the most exciting idea for an options trade but the contrarian profile also makes it endearing. In the past 10 weeks, COST stock has printed a 4-6-D sequence: four up weeks, six down weeks, with an overall downward trajectory. This sequence is surprisingly rare, accounting for only 6.8% of all identifiable patterns going back to January 2019.
Under 4-6-D conditions, COST stock would be projected to land mostly between $920 and approximately $1,000, with price clustering set to occur around $975 (assuming an anchor of $932.14). Usually, baseline conditions would see COST demonstrate price clustering around $962. Therefore, bullish speculators could potentially exploit a 1.35% positive delta in price density dynamics.
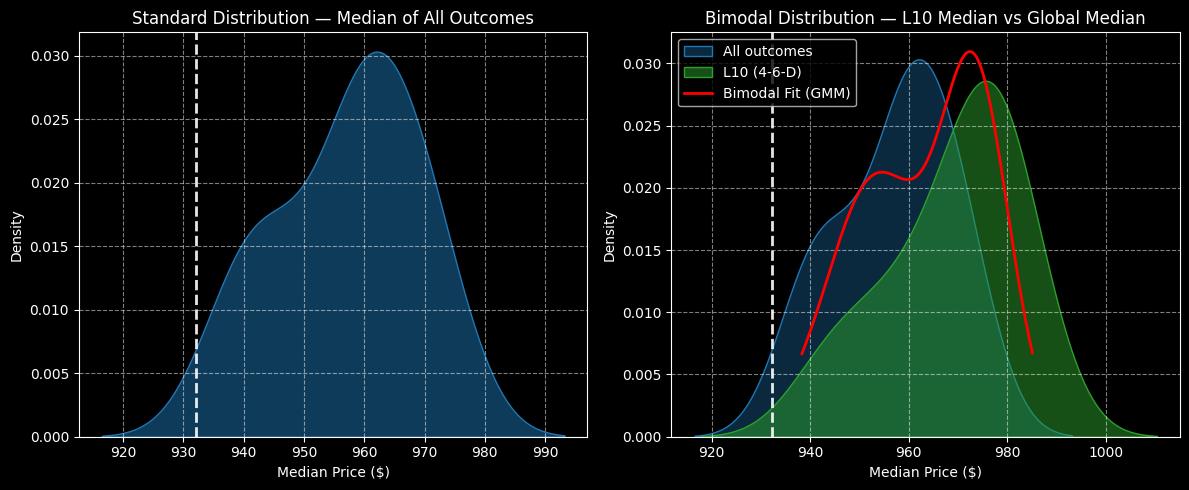
Granted, that doesn’t sound like much. However, when using options strategies like vertical spreads, small differences can be magnified. Further, market makers aren’t expecting a sizable rebound from COST stock.
Based on the data above, I’d take a close look at the 950/960 bull call spread expiring Dec. 19.
Spotify (SPOT)
While Spotify (SPOT) was seemingly all the rage, the spotlight shifted toward other enterprises. That’s not to say that SPOT stock is an underperformer. Since the start of this year, the security gained over 44%. However, near-term momentum has been weak, with SPOT losing more than 9% in the trailing month. Also, Barchart’s Technical Opinion indicator rates it a 24% Sell.
Despite the red ink, Spotify could be a contrarian candidate. In the past 10 weeks, SPOT stock has printed a 3-7-D sequence. As expected, this pattern is rare, representing only 6.25% of identifiable sequences. What’s fascinating is that SPOT’s probabilistic distribution features two price clustering peaks, with the first peak occurring at around $650, while the other peak stands at about $710.
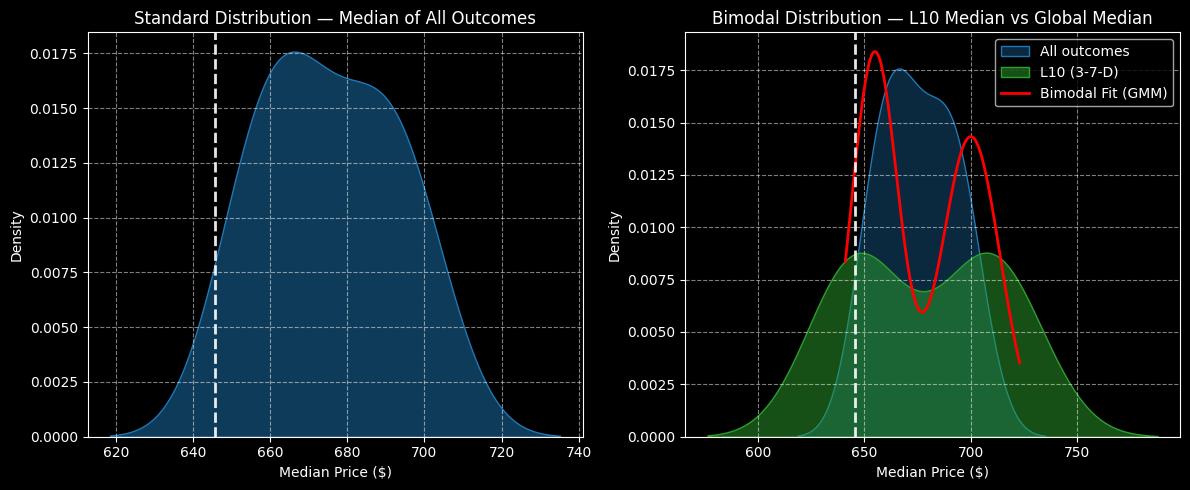
Under baseline conditions, price clustering is predominant at roughly $665. Therefore, SPOT stock is safer under homeostasis. When placed under 3-7-D conditions, both the risk and reward tails extend outward, creating both enhanced opportunities and dangers.
That said, the higher average price clustering may be enough to convince some speculators. If that’s you, take a look at the 700/720 bull spread expiring Dec. 19.