If it’s brown, flush it down — I’d say it’s a useful aphorism in most circumstances. However, when it comes to guacamole, in many cases, the dark hue is really just a discoloration. If you can get over the disturbing visuals, brown guac can be nutritious. In a similar vein, distressed securities may offer tremendous upside, so long as you pick the right ideas.
Of course, this raises the obvious question: how the heck do you know which stocks are ripe for big gains and which ones are well past their expiration dates? The answer may come from a surprising source — baseball.
When scouts analyze fresh prospects, they’re forced to plug in the performance statistics that they do have into a premade distribution, with the end output being a probabilistic simulation of what could happen in the big leagues.
On the other hand, free agents who already have a few years in “The Show” carry with them ample analytics. Teams can use this hard data to estimate future performance. Both approaches are probabilistic in nature but the former is prescriptive while the latter is descriptive.
Fundamentally, that’s what I’m offering with the sequencing logic — a descriptive model of what could happen in the future using past analogs. Specifically, I am hypothesizing that the distinct attributes of the last 10 weeks of price action can be instructive in how the next 10 weeks may pan out.
This hypothesis might sound esoteric but it’s really the GARCH volatility clustering concept that has been established by academia — but at a larger scale. Essentially, the market’s behavioral state over a given period of time may have a probabilistic impact over the next period beyond the baseline expectation.
This asymmetry is exactly what we’re trying to exploit.
Caesars Entertainment (CZR)
I’ve been keeping my eyes on Caesars Entertainment (CZR), in large part because of the security’s high short interest. At roughly 16% of the float and with the underlying ratio clocking in at 6.43 days to cover, CZR stock could be at risk of a short squeeze. Essentially, this term refers to the tail risk of an ever-rising obligatory payment as the underwritten event gets realized to the extreme ends of the distribution.
That’s a fancy way of saying CZR stock could explode higher due to the wave of buy-to-close transactions originating from panicked bears.
However, the other signal that Caesars could pop is in the quantitative realm. In the past two months, CZR stock printed a 6-4-D sequence: six up weeks, four down weeks, with an overall downward trajectory. This rare sequence has flashed only 19 times on a rolling basis since January 2019. Seven weeks out, the bulls have a slight edge in terms of exceedance ratio (52.6%).
At first glance, this ratio doesn’t sound all that high. However, the median price of outcomes associated with the 6-4-D sequence lands at $29.38. In other words, half of outcomes came in above this point and half below.
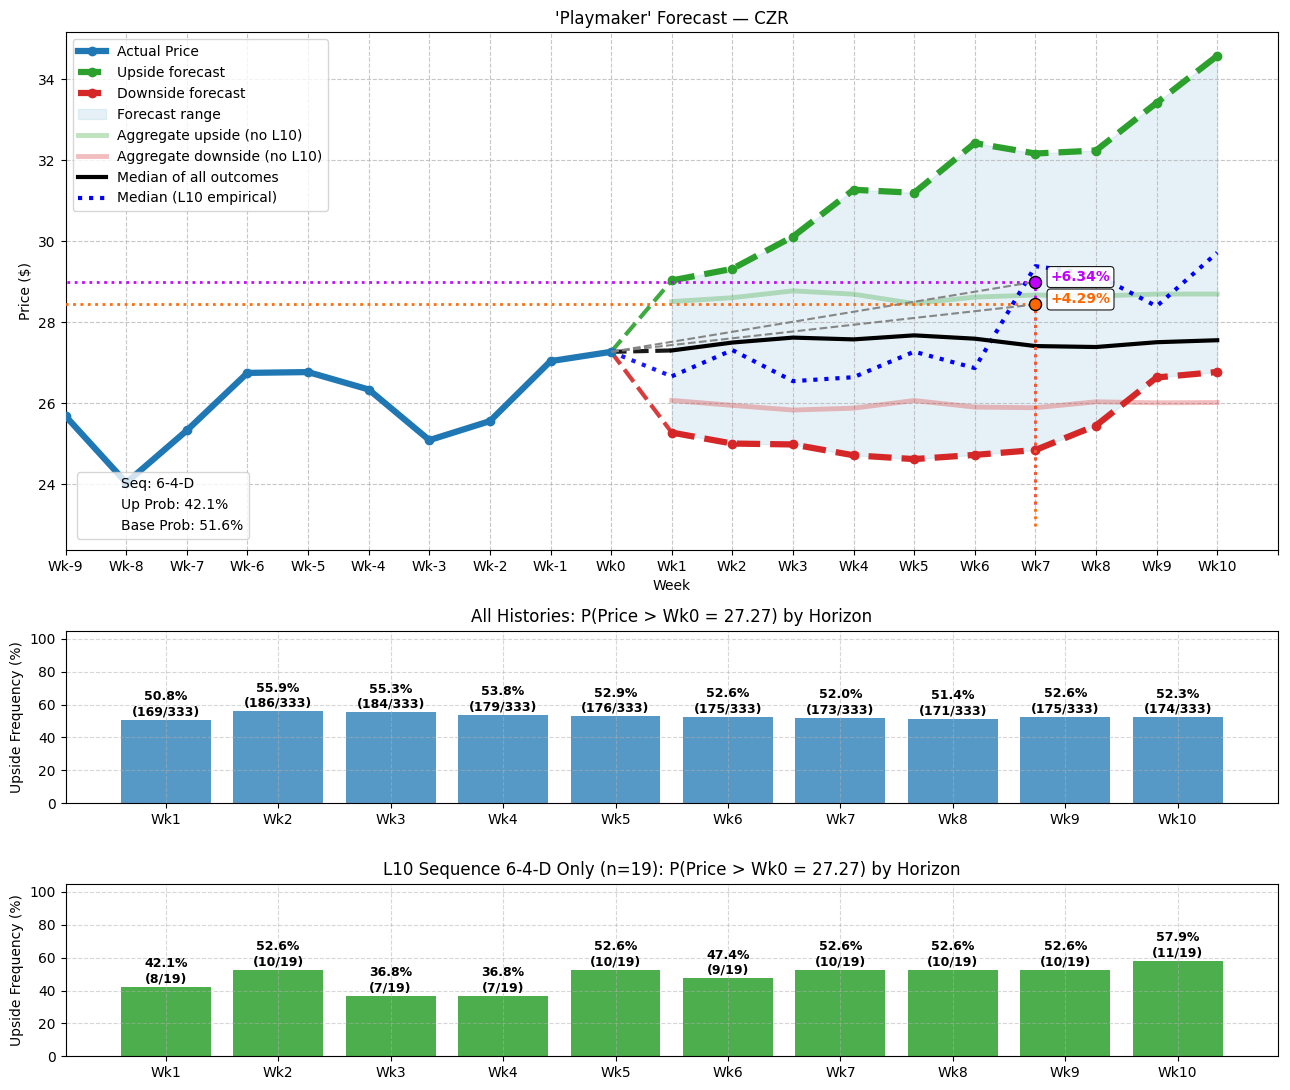
With this knowledge, we can take the data from Barchart Premier to identify an asymmetrically favorable options strategy. My vote goes for the 28/29 bull call spread expiring Nov. 21. If CZR stock rises through the second-leg strike price ($29) at expiration — which is well within empirical possibility — the maximum payout stands at over 127%.
Zillow (Z)
Real estate specialist Zillow (Z) has been all over the map this year. In the trailing six months, Z stock has gained over 15% of market value. However, on a year-to-date basis, the security is up less than 4%. You can blame the uncertain economy as well as tough lending conditions. Still, with the Federal Reserve implementing a more dovish strategy, Zillow could be interesting.
Quantitatively, Z stock has printed a 3-7-D sequence: three up weeks, seven down weeks, with an overall downward trajectory. This distribution-heavy sequence is one of my favorites, so to speak, because of the emotions involved. If a security has buy-the-dip sentiments, it should probabilistically move higher at a greater frequency than would be expected under baseline conditions. That’s exactly what I’m noticing with Zillow.
Going back to January 2019, Z stock has printed the 3-7-D a total of 22 times on a rolling basis. Now, in the seventh week, the exceedance ratio stands at 59.1%. Even better, the median price is above $80. As you might guess, I’m digging the 77.50/80 bull call spread expiring Nov. 21.
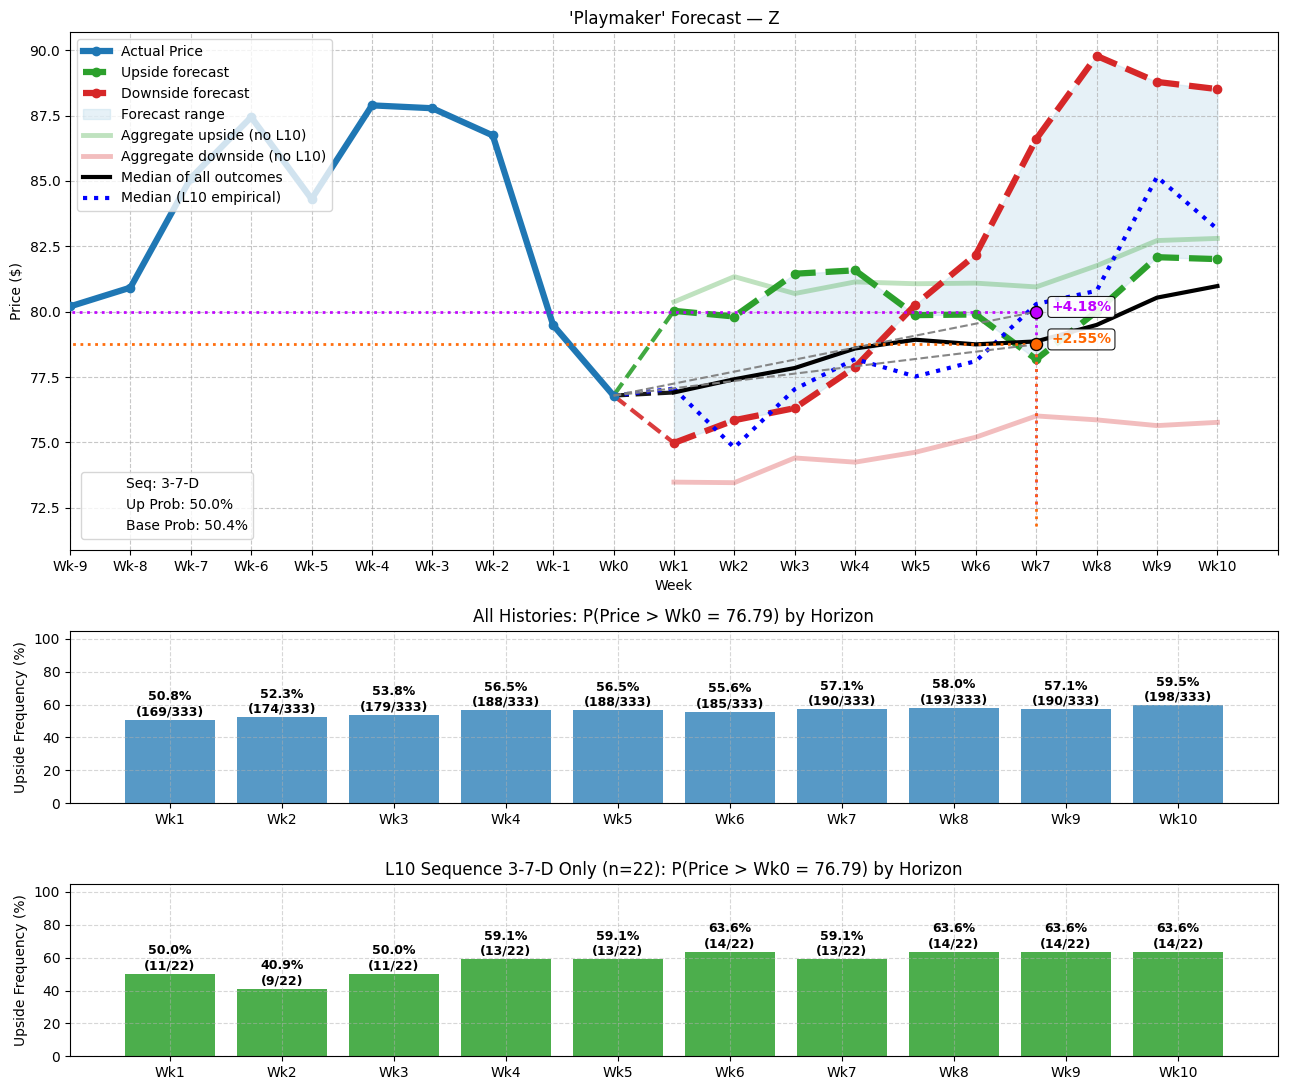
Sure, the payout if Z stock rises through $80 at expiration is “only” 100%. However, the frequency of success is relatively high, making it an attractive wager.
Intuitive Surgical (ISRG)
To be blunt, biotechnology-related names aren’t always the best trading candidates because of their multi-dimensional narratives. With such enterprises, both the business and the underlying science must appease investors; otherwise, the volatility could be devastating. That’s both the risk and the allure of Intuitive Surgical (ISRG), a company that specializes in advanced robot-assisted surgical systems.
Quantitatively, ISRG stock has flashed a 3-7-D sequence. Ordinarily, such a distribution-heavy sequence would generally serve as a warning. Indeed, ISRG finds itself down more than 13% since the beginning of this year. Also, in the trailing six months, at a time when so many stocks have witnessed blistering gains, this equity has barely poked its head above parity.
Still, what’s really attractive about Intuitive is that investors gravitate toward its perceived discounts. Since January 2019, the 3-7-D has flashed 30 times on a rolling basis. In the seventh week, the exceedance ratio jumps to 66.7%. Further, the median price of outcomes tied to the sequence stands at $487.48.
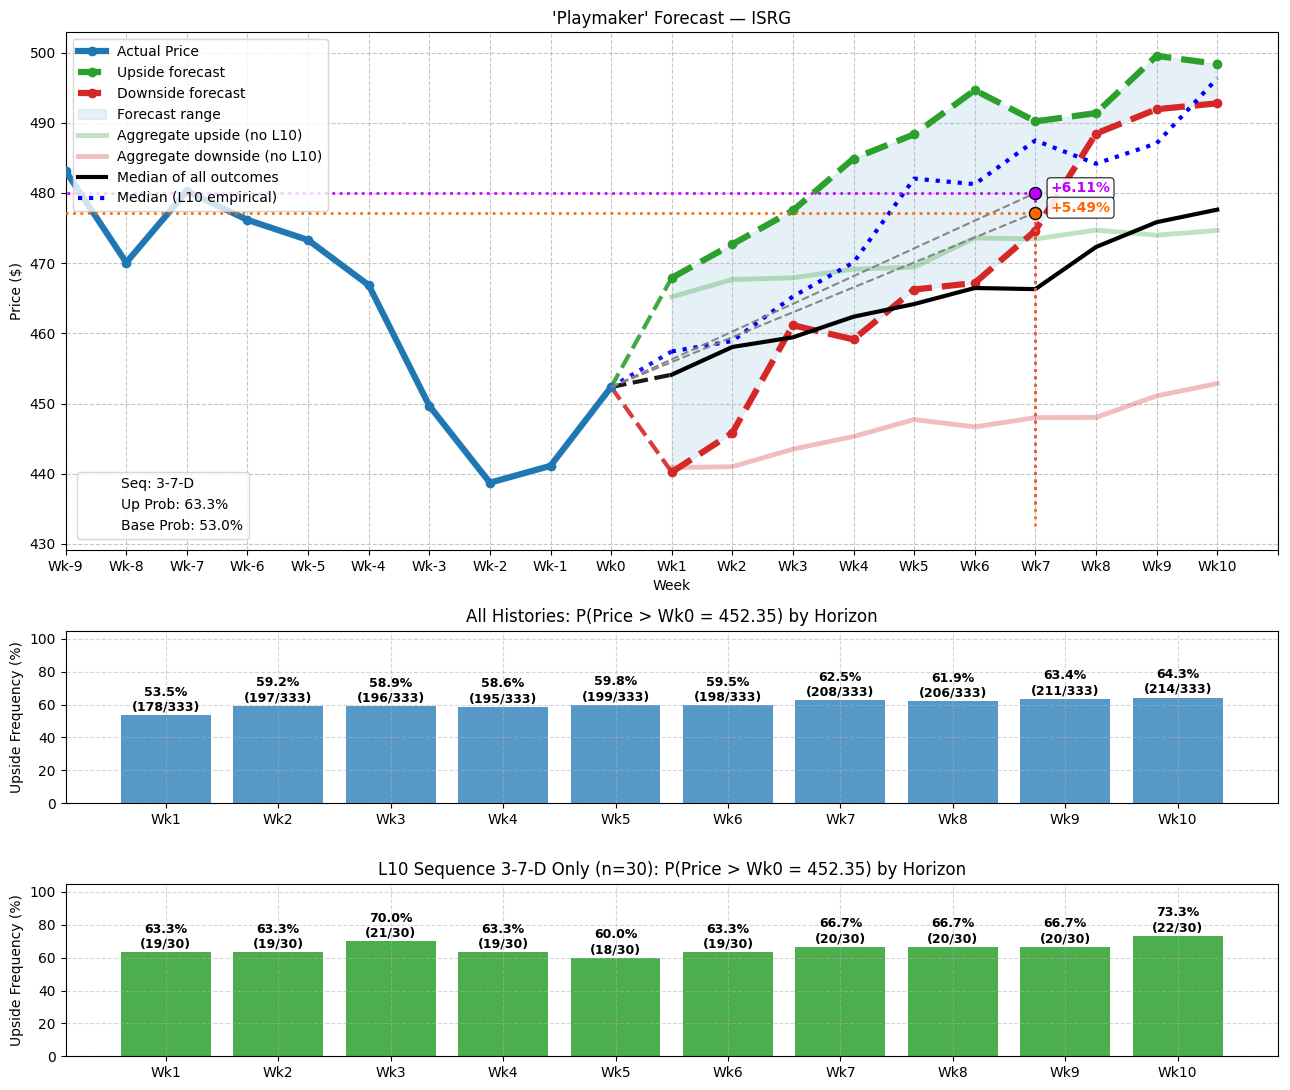
For speculators looking for an enticing wager, the 475/480 bull spread expiring Nov. 21 could fit the bill. Should ISRG stock rise through the second-leg strike price, the maximum payout is over 127%.
On the date of publication, Josh Enomoto did not have (either directly or indirectly) positions in any of the securities mentioned in this article. All information and data in this article is solely for informational purposes. For more information please view the Barchart Disclosure Policy here.