You might be familiar with the safest and wealthiest U.S. cities to live in circa 2024, but how do those rankings stack up against this year’s results?
Read More: GOBankingRates Original Research Center
Try This: 4 Affordable Car Brands You Won't Regret Buying in 2025
GOBankingRates’ 2025 original research on the nation’s safest and richest cities to live added 20 more cities to the overall ranking — for a total of 50 cities. The top 1,000 cities with the highest household mean income were identified using the U.S. Census American Community Survey. Additional data points include the average home value, annual cost of living and property and violent crime rates.

Key Findings
- Western Springs, Illinois, again ranks as the nation’s safest and richest city to live. As of 2025, the household mean income is $294,896.
- Four cities in Wisconsin, Michigan, Maryland and Ohio debuted among the richest and safest in this year’s top 10. In order of the states mentioned, they include Whitefish Bay (#4), Huntington Woods (#5), University Park (#9) and Upper Arlington (#10).
- Only two California cities — Mill Valley (#27) and Lafayette (#47) — cracked this year’s top 50. Seven California cities were featured in 2024’s top 30.
- Illinois experienced the biggest jump in wealthy cities to rank in the top 50 — with 12 cities this year compared to four in 2024. These 12 cities are Western Springs (#1), Winnetka (#7), Kenilworth (#8), Libertyville (#16), Hinsdale (#17), Deerfield (#28), Park Ridge (#33), Elmhurst (#34), Wilmette (#35), La Grange (#38), Glen Ellyn (#42) and Naperville (#49).
- No Florida cities made the rankings in 2024 or 2025.
See which 50 U.S. cities are the safest and richest to live in this year.
That’s Interesting: I Asked ChatGPT If a Recession Is Coming Soon — Here’s What It Said
View More: Here’s How Much Every Tax Bracket Would Gain — or Lose — Under Trump’s ‘Big, Beautiful Bill’

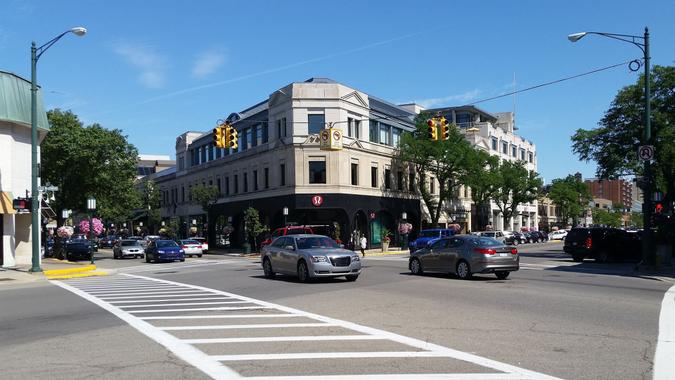
1. Western Springs, Illinois
- Household mean income: $294,896
- Single family home average value: $837,238
- Total cost of living annually: $84,810
- Property crime rate (per 1,000): 2.657
- Violent crime rate (per 1,000): 0.076
See Next: 8 Smart Ways Frugal People Are Living Like There’s Already a Recession
2. Lexington, Massachusetts
- Household mean income: $300,716
- Single family home average value: $1,697,821
- Total cost of living annually: $145,764
- Property crime rate (per 1,000): 2.937
- Violent crime rate (per 1,000): 0.294

3. Winchester, Massachusetts
- Household mean income: $296,327
- Single family home average value: $1,721,011
- Total cost of living annually: $147,229
- Property crime rate (per 1,000): 4.029
- Violent crime rate (per 1,000): 0.221

4. Whitefish Bay, Wisconsin
- Household mean income: $208,063
- Single family home average value: $646,546
- Total cost of living annually: $69,458
- Property crime rate (per 1,000): 8.396
- Violent crime rate (per 1,000): 0.275

5. Huntington Woods, Michigan
- Household mean income: $225,070
- Single family home average value: $530,900
- Total cost of living annually: $62,174
- Property crime rate (per 1,000): 3.207
- Violent crime rate (per 1,000): 0.321

6. Ottawa Hills, Ohio
- Household mean income: $259,011
- Single family home average value: $435,312
- Total cost of living annually: $52,730
- Property crime rate (per 1,000): 6.468
- Violent crime rate (per 1,000): 0.417
Learn More: J.P. Morgan — 3 Reasons the US Dollar Is Losing Value — and Why It Might Be Good for Your Wallet

7. Winnetka, Illinois
- Household mean income: $457,404
- Single family home average value: $1,803,555
- Total cost of living annually: $153,532
- Property crime rate (per 1,000): 6.144
- Violent crime rate (per 1,000): 0.164
8. Kenilworth, Illinois
- Household mean income: $460,411
- Single family home average value: $1,945,017
- Total cost of living annually: $163,712
- Property crime rate (per 1,000): 4.189
- Violent crime rate (per 1,000): 0.000

9. University Park, Maryland
- Household mean income: $239,838
- Single family home average value: $695,938
- Total cost of living annually: $75,913
- Property crime rate (per 1,000): 16.532
- Violent crime rate (per 1,000): 0.424

10. Upper Arlington, Ohio
- Household mean income: $208,451
- Single family home average value: $687,463
- Total cost of living annually: $71,587
- Property crime rate (per 1,000): 9.203
- Violent crime rate (per 1,000): 0.140
11. Ridgewood, New Jersey
- Household mean income: $288,861
- Single family home average value: $1,182,764
- Total cost of living annually: $112,398
- Property crime rate (per 1,000): 6.252
- Violent crime rate (per 1,000): 0.379
Be Aware: Here’s How Much Cash You Need Stashed To Survive a Recession in the Midwest

12. Hudson, Ohio
- Household mean income: $216,934
- Single family home average value: $556,085
- Total cost of living annually: $61,805
- Property crime rate (per 1,000): 4.335
- Violent crime rate (per 1,000): 0.525
13. Westfield, New Jersey
- Household mean income: $297,367
- Single family home average value: $1,263,623
- Total cost of living annually: $117,378
- Property crime rate (per 1,000): 8.662
- Violent crime rate (per 1,000): 0.164

14. Wellesley, Massachusetts
- Household mean income: $368,179
- Single family home average value: $2,098,597
- Total cost of living annually: $174,523
- Property crime rate (per 1,000): 4.326
- Violent crime rate (per 1,000): 0.256

15. Madeira, Ohio
- Household mean income: $246,617
- Single family home average value: $535,451
- Total cost of living annually: $61,439
- Property crime rate (per 1,000): 4.160
- Violent crime rate (per 1,000): 0.213

16. Libertyville, Illinois
- Household mean income: $214,676
- Single family home average value: $647,306
- Total cost of living annually: $69,234
- Property crime rate (per 1,000): 6.397
- Violent crime rate (per 1,000): 0.394
Read Next: I’m an Economist — Here’s How Likely a Recession Is for the Second Half of 2025

17. Hinsdale, Illinois
- Household mean income: $376,366
- Single family home average value: $1,259,123
- Total cost of living annually: $114,926
- Property crime rate (per 1,000): 3.554
- Violent crime rate (per 1,000): 0.117
18. Birmingham, Michigan
- Household mean income: $240,711
- Single family home average value: $822,581
- Total cost of living annually: $82,101
- Property crime rate (per 1,000): 8.947
- Violent crime rate (per 1,000): 0.369

19. Purcellville, Virginia
- Household mean income: $189,791
- Single family home average value: $898,023
- Total cost of living annually: $91,010
- Property crime rate (per 1,000): 5.784
- Violent crime rate (per 1,000): 0.334

20. Sammamish, Washington
- Household mean income: $280,644
- Single family home average value: $1,757,741
- Total cost of living annually: $149,693
- Property crime rate (per 1,000): 6.486
- Violent crime rate (per 1,000): 0.246

21. Madison, New Jersey
- Household mean income: $247,235
- Single family home average value: $1,047,592
- Total cost of living annually: $102,035
- Property crime rate (per 1,000): 4.807
- Violent crime rate (per 1,000): 0.125
For You: What Is the Estimated Median Income for the Upper-Middle Class in 2025?
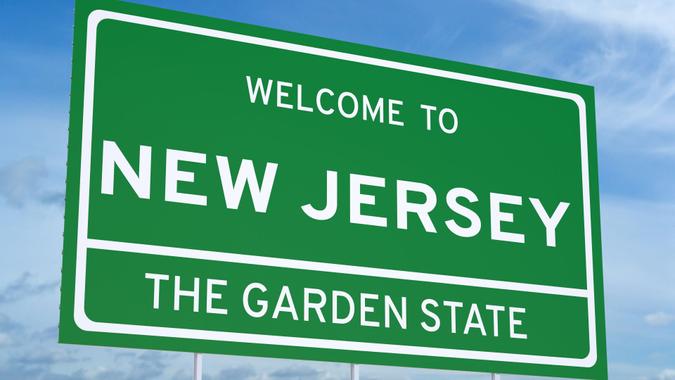
22. Haddonfield, New Jersey
- Household mean income: $279,257
- Single family home average value: $832,771
- Total cost of living annually: $83,587
- Property crime rate (per 1,000): 13.310
- Violent crime rate (per 1,000): 0.239

23. Glen Ridge, New Jersey
- Household mean income: $300,489
- Single family home average value: $1,165,641
- Total cost of living annually: $111,066
- Property crime rate (per 1,000): 17.652
- Violent crime rate (per 1,000): 0.370

24. Snoqualmie, Washington
- Household mean income: $245,628
- Single family home average value: $1,202,635
- Total cost of living annually: $110,755
- Property crime rate (per 1,000): 13.137
- Violent crime rate (per 1,000): 0.149

25. Wyoming, Ohio
- Household mean income: $203,661
- Single family home average value: $509,376
- Total cost of living annually: $58,841
- Property crime rate (per 1,000): 9.066
- Violent crime rate (per 1,000): 0.232

26. Belmont, Massachusetts
- Household mean income: $239,287
- Single family home average value: $1,686,352
- Total cost of living annually: $144,788
- Property crime rate (per 1,000): 8.435
- Violent crime rate (per 1,000): 0.603
Explore More: Here’s the Minimum Net Worth To Be Considered Upper Class in Your 50s

27. Mill Valley, California
- Household mean income: $308,154
- Single family home average value: $2,111,866
- Total cost of living annually: $176,163
- Property crime rate (per 1,000): 7.983
- Violent crime rate (per 1,000): 0.503
28. Deerfield, Illinois
- Household mean income: $246,543
- Single family home average value: $712,853
- Total cost of living annually: $74,156
- Property crime rate (per 1,000): 5.040
- Violent crime rate (per 1,000): 0.318

29. Reading, Massachusetts
- Household mean income: $187,490
- Single family home average value: $977,318
- Total cost of living annually: $94,467
- Property crime rate (per 1,000): 4.854
- Violent crime rate (per 1,000): 0.278

30. Narberth, Pennsylvania
- Household mean income: $210,873
- Single family home average value: $986,544
- Total cost of living annually: $94,984
- Property crime rate (per 1,000): 11.148
- Violent crime rate (per 1,000): 0.223

31. Summit, New Jersey
- Household mean income: $304,408
- Single family home average value: $1,368,214
- Total cost of living annually: $124,152
- Property crime rate (per 1,000): 8.216
- Violent crime rate (per 1,000): 0.494
Find Out: What Salary Single People Need To Live Comfortably in 100 Major US Cities

32. Pleasant Ridge, Michigan
- Household mean income: $197,870
- Single family home average value: $482,215
- Total cost of living annually: $58,386
- Property crime rate (per 1,000): 5.058
- Violent crime rate (per 1,000): 2.335

33. Park Ridge, Illinois
- Household mean income: $187,830
- Single family home average value: $610,055
- Total cost of living annually: $68,801
- Property crime rate (per 1,000): 8.175
- Violent crime rate (per 1,000): 0.664

34. Elmhurst, Illinois
- Household mean income: $200,730
- Single family home average value: $631,934
- Total cost of living annually: $70,240
- Property crime rate (per 1,000): 9.168
- Violent crime rate (per 1,000): 0.400

35. Wilmette, Illinois
- Household mean income: $291,930
- Single family home average value: $1,005,748
- Total cost of living annually: $96,945
- Property crime rate (per 1,000): 11.651
- Violent crime rate (per 1,000): 0.335
36. University Park, Texas
- Household mean income: $389,868
- Single family home average value: $2,432,712
- Total cost of living annually: $195,836
- Property crime rate (per 1,000): 11.483
- Violent crime rate (per 1,000): 0.319
Discover More: Here’s the Minimum Salary Required To Be Considered Upper-Middle Class in 2025

37. Sharon, Massachusetts
- Household mean income: $213,836
- Single family home average value: $899,720
- Total cost of living annually: $91,254
- Property crime rate (per 1,000): 2.710
- Violent crime rate (per 1,000): 0.271
38. La Grange, Illinois
- Household mean income: $210,646
- Single family home average value: $705,658
- Total cost of living annually: $75,553
- Property crime rate (per 1,000): 9.616
- Violent crime rate (per 1,000): 1.603

39. Hopkinton, Massachusetts
- Household mean income: $295,018
- Single family home average value: $1,001,895
- Total cost of living annually: $97,022
- Property crime rate (per 1,000): 3.528
- Violent crime rate (per 1,000): 0.665
40. Newton, Massachusetts
- Household mean income: $261,666
- Single family home average value: $1,737,762
- Total cost of living annually: $148,234
- Property crime rate (per 1,000): 5.563
- Violent crime rate (per 1,000): 0.586
41. Needham, Massachusetts
- Household mean income: $281,049
- Single family home average value: $1,595,565
- Total cost of living annually: $139,457
- Property crime rate (per 1,000): 7.366
- Violent crime rate (per 1,000): 0.774
Explore Next: Salary Needed To Achieve the American Dream in the 50 Largest Cities

42. Glen Ellyn, Illinois
- Household mean income: $190,562
- Single family home average value: $605,296
- Total cost of living annually: $68,523
- Property crime rate (per 1,000): 6.043
- Violent crime rate (per 1,000): 0.462
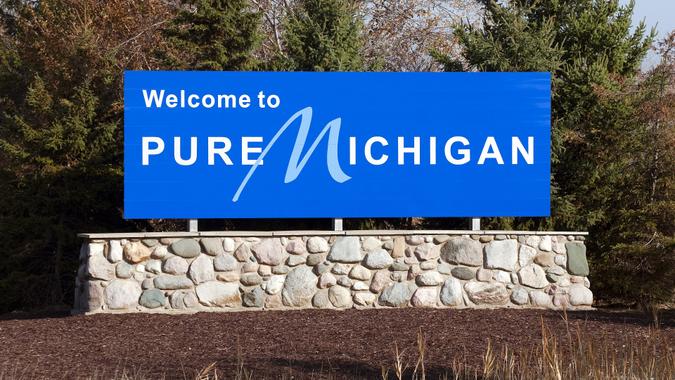
43. Beverly Hills, Michigan
- Household mean income: $202,450
- Single family home average value: $563,075
- Total cost of living annually: $64,401
- Property crime rate (per 1,000): 4.918
- Violent crime rate (per 1,000): 0.964

44. Keller, Texas
- Household mean income: $217,210
- Single family home average value: $650,165
- Total cost of living annually: $71,569
- Property crime rate (per 1,000): 7.996
- Violent crime rate (per 1,000): 0.689
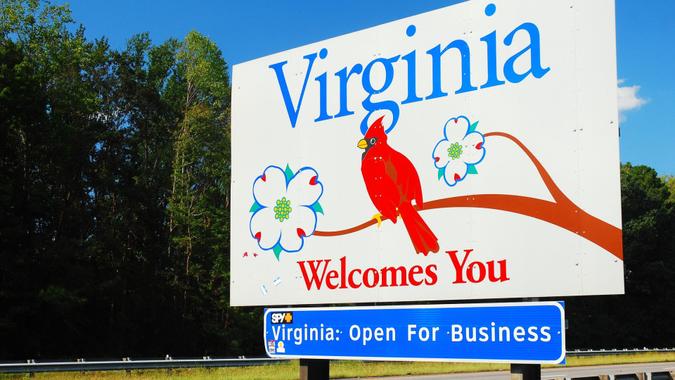
45. Vienna, Virginia
- Household mean income: $273,768
- Single family home average value: $1,197,684
- Total cost of living annually: $111,327
- Property crime rate (per 1,000): 8.400
- Violent crime rate (per 1,000): 1.173

46. Fox Point, Wisconsin
- Household mean income: $239,298
- Single family home average value: $556,377
- Total cost of living annually: $63,474
- Property crime rate (per 1,000): 9.340
- Violent crime rate (per 1,000): 0.306
Trending Now: 9 Things the Middle Class Should Consider Downsizing To Save on Monthly Expenses

47. Lafayette, California
- Household mean income: $319,744
- Single family home average value: $1,945,074
- Total cost of living annually: $165,358
- Property crime rate (per 1,000): 12.459
- Violent crime rate (per 1,000): 0.804
48. Brookline, Massachusetts
- Household mean income: $217,943
- Single family home average value: $1,703,401
- Total cost of living annually: $147,401
- Property crime rate (per 1,000): 7.886
- Violent crime rate (per 1,000): 0.655
49. Naperville, Illinois
- Household mean income: $192,516
- Single family home average value: $645,120
- Total cost of living annually: $71,529
- Property crime rate (per 1,000): 8.582
- Violent crime rate (per 1,000): 0.639

50. Metuchen, New Jersey
- Household mean income: $190,858
- Single family home average value: $712,725
- Total cost of living annually: $78,779
- Property crime rate (per 1,000): 12.327
- Violent crime rate (per 1,000): 0.400
Find more original studies and surveys in the GOBankingRates original research center.
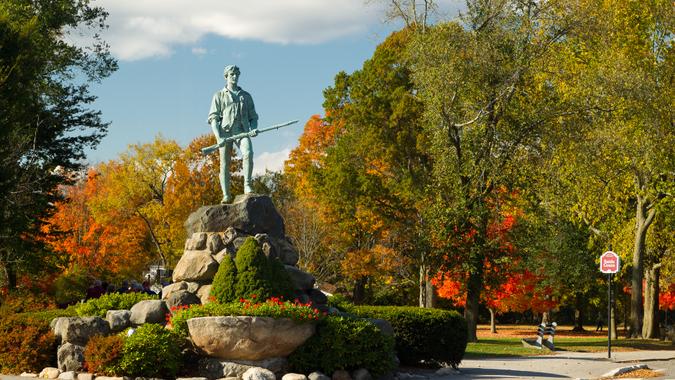
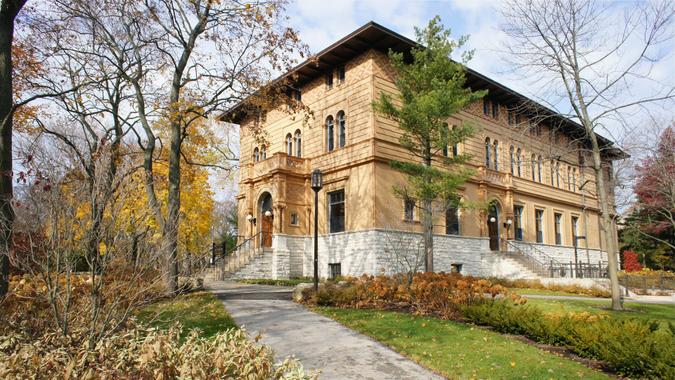
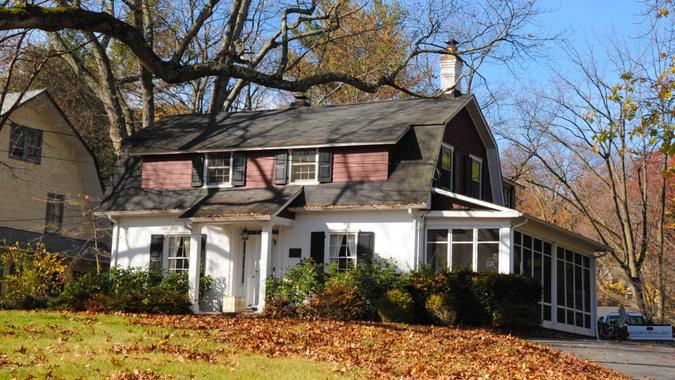
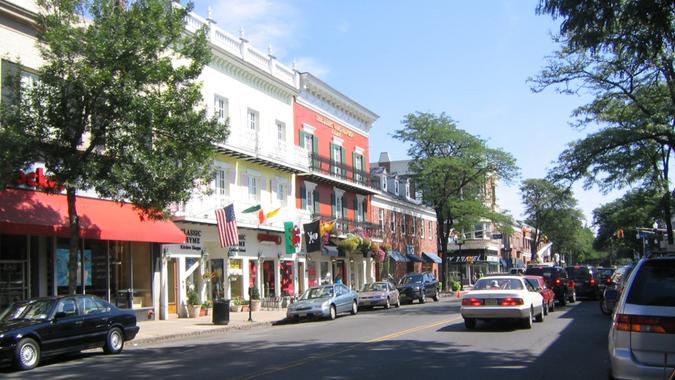
Editor’s note: Photos are for representational purposes only and might not reflect the exact locations listed.
Methodology: Using the U.S. Census American Community Survey, the 1,000 cities with the highest household mean income were identified. The average single-family home value was sourced from Zillow Home Value Index for May 2025. The cost-of-living indexes were sourced from Sperling’s BestPlaces and, using the national average expenditure costs for all households, as sourced from the Bureau of Labor Statistics Consumer Expenditure Survey, the average expenditure costs were calculated for each location. Using data from the Federal Bureau of Investigation’s Crime Data Explorer, the property crime rate per 1,000 residents and the violent crime rate per 1,000 residents were both calculated. The livability index was sourced from AreaVibes and any location with a livability index below 80 was removed for this study as it represents a location with a lower quality of life. Using the average mortgage (calculated from Federal Reserve data) and expenditure costs, the cost of living was calculated for each location. The total average cost of living was scored and weighted at 1.00, the property crime rate per 1,000 was scored and weighted at 1.00, the violent crime rate per 1,000 residents was scored and weighted at 1.00, the household mean income was scored and weighted at 1.00, and the livability index was scored and weighted at 1.00. All the scores were summed and sorted to show the safest and richest cities. All data was collected on and is up to date as of Aug. 4, 2025.
More From GOBankingRates
This article originally appeared on GOBankingRates.com: The Safest and Richest US Cities To Live in 2025