It's the summer of 2000 and the Nasdaq 100 has just delivered a staggering 300% gain over three years, but a sudden spike in volatility during the spring signals that equity valuations are starting to descend from their stratospheric highs.
The dot-com bubble had burst.
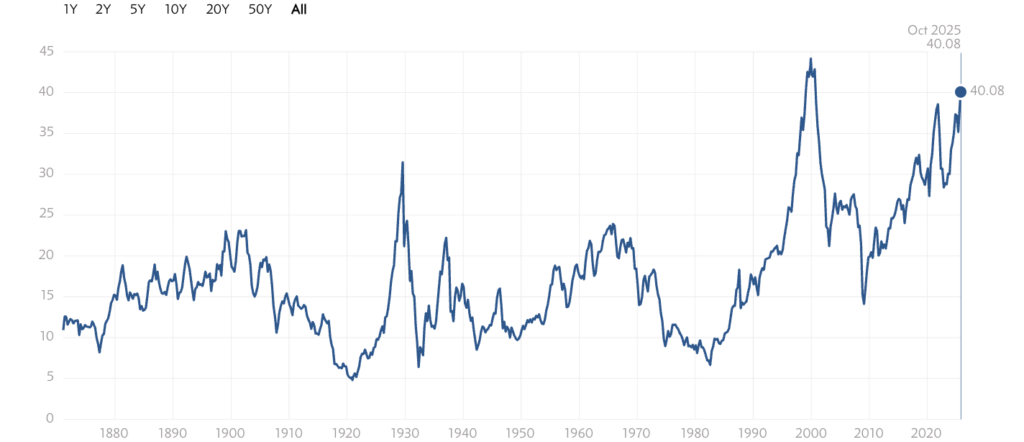
Fast forward 25 years, and a familiar indicator used to gauge stock bubbles now shows the U.S. market hasn't been this expensive since those euphoric days.
Source: Multpl.com (Shiller PE)
Shiller PE Near 2000 Tech Bubble Levels
The Shiller price-to-earnings ratio — also known as the cyclically adjusted PE or CAPE — has climbed to 40.08, a level only seen once before in history, in the summer of 2000, just before the dot-com crash.
The Shiller PE ratio, developed by Nobel laureate Robert Shiller, smooths out inflation-adjusted earnings over a 10-year period. It is often used as a long-term barometer of market valuation, filtering out short-term noise.
With its latest reading above 40, the index sits more than 130% above its historical mean of 17.29, flagging stark overvaluation.
It's a red flag for many, especially those trained to view soaring valuations as the first signs of a bubble.
Despite ballooning valuations — with high-flying names like Palantir Technologies Inc. (NASDAQ:PLTR) trading at a forward price-to-earnings ratio above 300 — analysts argue this isn’t the same kind of mania.
Is This Time Different?
During the lead-up to the 2000 crash, participation was widespread. Americans felt wealthy, secure, and confident in the future.
That euphoria spilled into the real economy: consumer sentiment peaked, car sales hit record highs and households used tech stocks as collateral to buy homes.
Today, despite record-breaking stock indices, the mood on the ground is anything but jubilant.
The absence of widespread retail participation, combined with weak consumer sentiment and economic imbalance, makes this cycle fundamentally different from 2000.
“Every bubble in history popped by central bank tightening, and no central bank in the world has hiked rates in the past 2 months,” said Bank of America’s chief investment strategist Michael Hartnett, in a note Friday.
Experts Say This Isn't Mania
Jordi Visser, managing director at 22V Research, said that while market valuations are undeniably stretched, the broader environment doesn't reflect a classic speculative bubble.
According to Visser, the AI boom is not simply a market story — it's a national strategy.
Both the U.S. and China are racing to lead in artificial intelligence, pouring billions into what they view as a technological arms race.
That ensures sustained investment regardless of sentiment, earnings multiples, or traditional business cycles.
As the expert highlighted, this is an era of compressed innovation, where firms risk obsolescence if they fall behind in releasing the next language model or chip.
"What we are seeing is not a bubble but a concentrated market," Visser said, pointing to the narrow leadership among a handful of AI-driven mega caps.
“This is not the broad mania of a bubble; it is the imbalance of narrow concentration,” he added.
This new cycle doesn't follow the familiar script of bubbles past.
There are no broad IPO frenzies, no mass participation, no societal euphoria. Instead, there's a widening disconnect between markets and the real economy. GDP growth is accelerating, but job creation is lagging.
Productivity is rising, yet wages are stagnating. AI is lifting corporate profits and equity markets, but households aren't feeling the benefit.
"Concentration for me is less stable," he said, warning that this kind of market structure can lead to "more, not less, scary falls whenever the AI fears spread."
Bottom Line
While the Shiller PE ratio is flashing warnings not seen since the peak of the dot-com bubble, analysts say this isn't a speculative mania—it's a market powered by a concentrated AI revolution, unfolding in a deeply unequal economy.
The risk today isn't euphoria; it's concentration.
Read Next:
Photo: Shutterstock