
Market Overview
Bulls were on parade last week, with the Dow Jones Industrial Average leading the rally higher. It finished up 2.30% on the week, but fell just short of a new all-time high. The S&P 500 and Nasdaq hit new all-time highs, and finished up 1.72% and 1.62%, respectively. We're starting to see greed creep back into the tape, and I'm not ruling out a blowoff top at this point. Still, any dips that follow through should be bought, especially on the crypto side of the market. Stimulus is coming, as the only way out of this fiscal mess is to grow our way out of it. We have an abbreviated report this week due to the holiday. Take some time to rest! It's very important especially in these markets.
Stocks I Like
Life360 (Ticker: LIF) – 31% Return Potential
What's Happening
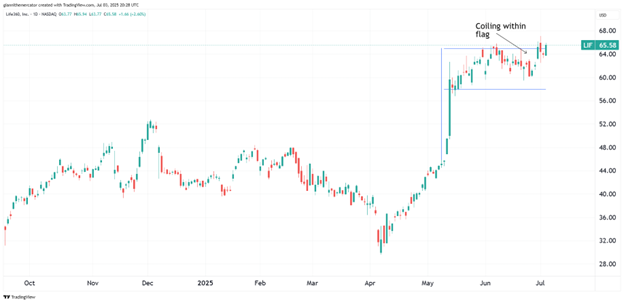
- Life360, Inc. (LIF) is a technology-driven company focused on providing family safety and location-sharing services, leveraging data and digital platforms to enhance user experiences and deliver innovative solutions for family connectivity and protection.
- The company has been steadily profitable over the past year, although there was a dip in earnings in the most recent quarter. Still, they reported revenue of $103.62 million and earnings of $5.37 million.
- This valuation on LIF is sky-high. P/E is at 501.69, Price-to-Sales is at 12.46, and EV to EBITDA is at 427.88.
- At a technical level, LIF is coiling within a bull flag formation. This is a very bullish setup that can lead to another leg higher in prices.
Why It's Happening
- The integration of "Tile" trackers and the rollout of new features in adjacent categories such as family financial tools, elderly care, and auto insurance are enhancing Life360's platform value. These innovations not only increase user engagement but also open up new monetization avenues, diversifying revenue streams and reducing reliance on any single segment.
- Life360's international penetration is accelerating, with MAUs outside the US growing 46% year-over-year in 2024. Regional penetration rates remain well below domestic levels—10% in the UK, 11% in Australia, and just 14% in the US—leaving ample headroom for further expansion.
- Other revenue streams, including advertising and partnerships, grew 41% to $36 million in 2024. With a massive and engaged user base, Life360 is well-positioned to capitalize on targeted advertising and strategic partnerships. Analysts expect advertising revenue to continue growing significantly, providing a powerful incremental tailwind that could surprise to the upside and drive further stock gains.
- Life360's MAUs reached approximately 83.7 million in Q1 2025, reflecting a 30% year-over-year increase. This rapid expansion is especially impressive given the company's already substantial user base, suggesting that Life360's brand and platform are resonating deeply with families worldwide.
- Life360 delivered a blowout first quarter in 2025, with total revenue surging 32% year-over-year to $103.6 million, marking its strongest Q1 ever. This performance was fueled by record highs in Monthly Active Users (MAUs), paying subscribers, and net additions, demonstrating that the company's platform is experiencing accelerating adoption even as consumer spending remains cautious.
- Subscription revenue soared to $277.8 million for full-year 2024, up 26% year-over-year, and continued to accelerate into Q1 2025.
- Analyst Ratings:
- UBS: Buy
- JMP Securities: Market Outperform
- UBS: Buy
My Action Plan (31% Return Potential)
- I am bullish on LIF above $55.00-$56.00. My upside target is $85.00-$87.00.
UP Fintech (Ticker: TIGR) – 54% Return Potential
What's Happening
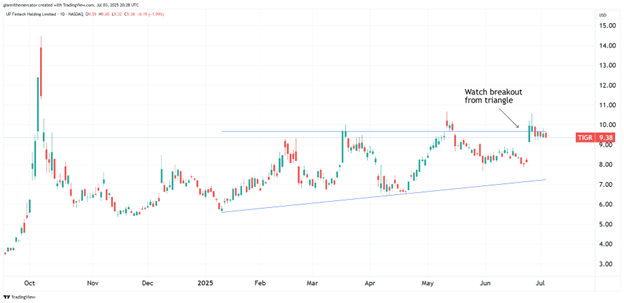
- UP Fintech Holding Limited (TIGR) is a technology-driven online brokerage company focused on providing innovative, accessible, and user-friendly trading platforms, leveraging data and digital solutions to enhance investor experiences and streamline financial services.
- Revenue is trending in the right direction for TIGR, but there are still earnings problems. The latest report showed revenue of $121.27 million, but no earnings to report.
- Valuation in TIGR is decent. P/E is at 21.44, Price-to-Sales is at 3.86, and EV to EBITDA is at 7.46.
- From a charting standpoint, TIGR is coiling tightly within a triangle formation. If it clears resistance, look for a big breakout higher.
Why It's Happening
- The company added 60,900 new funded accounts in Q2 2025, a 111.2% year-over-year increase. This rapid expansion in active users is a clear sign of UP Fintech's growing brand appeal and successful marketing strategies. Higher user growth translates to more trading activity, greater cross-selling opportunities, and a broader foundation for future revenue.
- Both institutional and retail clients contributed positively to net asset inflows in Q2, demonstrating UP Fintech's broad market appeal and diversified client base1. A balanced mix of client types enhances revenue stability and reduces dependence on any single segment, making the company more resilient to market fluctuations.
- UP Fintech boasts a gross profit margin of 83.8%, underscoring its ability to scale efficiently and maintain strong pricing power. High margins are a hallmark of sustainable business models in fintech, providing ample room for reinvestment in technology and user acquisition while supporting future profitability.
- UP Fintech reported that client assets reached a new record high in Q2, increasing by double digits compared to the previous quarter. Sustained net asset inflows indicate growing trust from both retail and institutional clients, which not only boosts recurring revenue but also enhances the company's valuation through a larger, more engaged user base.
- UP Fintech delivered total revenue of $122.6 million in Q1 2025, representing a massive 55.3% increase compared to the same period last year.
- The company's net profit surged by an impressive 146.7% in Q1 2025, fueled by heightened trading activity and increased commission income.
- Analyst Ratings:
- Daiwa Capital: Hold
- Citigroup: Sell
My Action Plan (54% Return Potential)
- I am bullish on TIGR above $8.25-$8.50. My upside target is $14.50-$15.00.
Market-Moving Catalysts for the Week Ahead
What's the Story on Jobs?
It seems to be a recurring theme over the past several months where the ADP and BLS employment reports show completely different narratives. This happened again last week where the ADP report showed a weakening labor market, but BLS showed a resilient one.
So, what's the real story? All I know is I'm seeing more reports of companies laying off workers and hearing stories about people finding it more difficult to find work. Part of it has to do with artificial intelligence, but part of it is also cost-saving measures from companies.
We've been looking at September for the next rate cut. I would forget about a rate cut in July at this point. Between the new budget bill and rate cuts on the horizon, it looks like this market is about to get pumped to another level.
A Lull in the Headlines?
We have FOMC minutes this week, but don't let the absence of other data releases fool you. I'm looking right at the July 9 tariff deadline, which could potentially be a source for the market's next round of volatility.
Some deals have been struck although there appears to be some lingering issues with Japan and the European Union especially. At the end of the day, any exporting nation wants and basically needs to sell to the U.S. market.
And don't even get me started on the delusional idea that tariffs are inflationary. Nobody believes taxes are inflationary, and tariffs are a tax. You can agree or disagree with the idea of tariffs, but never let political biases creep into your portfolio. It's job is to make money, not be right.
Sector & Industry Strength
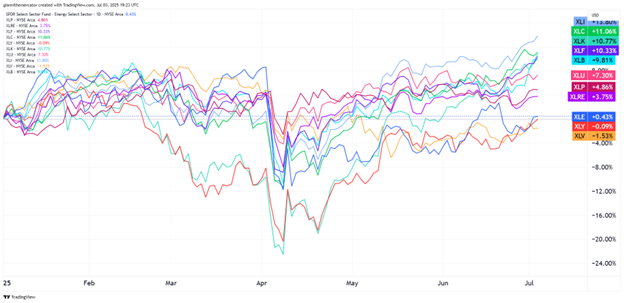
Overall, the state of the stock market's sectors continues to point to bullish momentum and more upside. All of the right sectors continue to lead, and save for consumer discretionary (XLY), all of the right sectors continue to lag year-to-date.
Eight of the eleven S&P sectors are solidly in positive territory year-to-date. Industrials (XLI) are still on top of the throne, but we saw quite a rebound from the communications (XLC) sector in recent sessions.
Utilities (XLU) and consumer staples (XLP) are right in the middle of the pack, which is another boon for bulls. If either of these sectors, or even healthcare (XLV) starts to climb in the next week or two, we can start preparing for a market pullback. Until then, ride the wave.
| 1 week | 3 Weeks | 13 Weeks | 26 Weeks |
| Basic Materials | Technology | Technology | Industrials |
Editor's Note: This tape's all about growth – for now.
Comparing Leaders (Sector ETF: XLI/XLK)
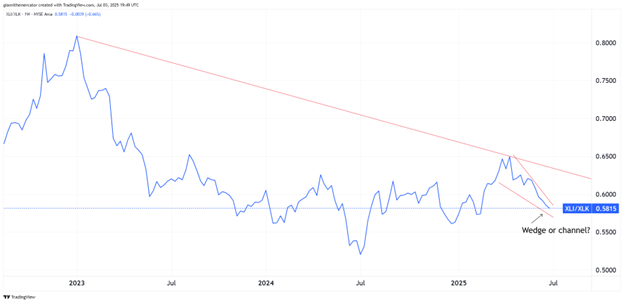
I want to stack the two most important sectors of the moment this week to see where the money is flowing. Industrials (XLI) have been the leader year-to-date, but technology (XLK) has been the leader since the April 7 bottom.
This is reflected in the ratio chart between XLI and XLK, as it topped out in April and has been trending lower ever since. The big question now is whether we see a wedge formation or a channel, as these two scenarios suggest two very different outcomes.
If this is a channel, I expect XLK to keep outperforming XLI, but if this is a wedge, then we'll see XLK slow down and XLI reassume leadership. For the overall market, XLK leading is more bullish.
Junk Bonds Leading (Sector ETF: HYG/IEI)
You know what they say – credit leads – and when we see leadership from junk bonds (HYG), it's hardly a bearish signal, especially when it comes to its performance against 3-7 Year Treasuries (IEI).
Note how credit spreads blew out during the correction into the April 7 low. If anything, that was the event of the year, and the likelihood of that happening again in the next 6 months is not very high.
With respect to the longer-term trend, it was a higher-low, but it did take out the low from summer 2024. So, at this point, it's new all-time highs or bust for this ratio. If we're going to be bullish, we don't want to see this ratio turn sharply lower.

My Take:
Junk bonds trade like stocks more than bonds, hence their "junk" status. But when it's leading, it suggests a calm sailing environment. Bull markets climb a wall of worry, and the press does a great job at keeping people worried as all the signals point to higher prices ahead.
Junk bonds give us an idea on the state of liquidity. When market conditions worsen, people seek safety in Treasuries and higher-quality names. Obviously, junk bonds do not fall into that category of quality.
Cryptocurrency
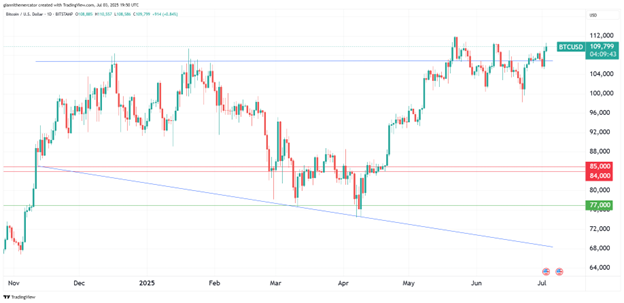
Don't be surprised if we finally see a liftoff in the price of Bitcoin in the coming days. It continues to consolidate above the critical $100,000-$105,00 support level that acted as major resistance throughout early 2025. Above this key technical level, bulls are in control of this market.
The duration of this wedge formation lends itself to the idea of a massive move coming. the very least, we're looking for it to go above 130,000-135,000, but I want to see a new all-time high in the coming days first.
It's still in an uptrend, but has spent the past several weeks consolidating near the highs, which as a rule, is bullish price action. There's no need to complicate things here, although I am starting to look at some other coins for even more upside. Stay tuned.
Legal Disclosures:
This communication is provided for information purposes only.
This communication has been prepared based upon information, including market prices, data and other information, from sources believed to be reliable, but Benzinga does not warrant its completeness or accuracy except with respect to any disclosures relative to Benzinga and/or its affiliates and an analyst’s involvement with any company (or security, other financial product or other asset class) that may be the subject of this communication. Any opinions and estimates constitute our judgment as of the date of this material and are subject to change without notice. Past performance is not indicative of future results. This communication is not intended as an offer or solicitation for the purchase or sale of any financial instrument. Benzinga does not provide individually tailored investment advice. Any opinions and recommendations herein do not take into account individual client circumstances, objectives, or needs and are not intended as recommendations of particular securities, financial instruments or strategies to particular clients. You must make your own independent decisions regarding any securities, financial instruments or strategies mentioned or related to the information herein. Periodic updates may be provided on companies, issuers or industries based on specific developments or announcements, market conditions or any other publicly available information. However, Benzinga may be restricted from updating information contained in this communication for regulatory or other reasons. Clients should contact analysts and execute transactions through a Benzinga subsidiary or affiliate in their home jurisdiction unless governing law permits otherwise.
This communication may not be redistributed or retransmitted, in whole or in part, or in any form or manner, without the express written consent of Benzinga. Any unauthorized use or disclosure is prohibited. Receipt and review of this information constitutes your agreement not to redistribute or retransmit the contents and information contained in this communication without first obtaining express permission from an authorized officer of Benzinga. Copyright 2022 Benzinga. All rights reserved.