Market Overview
Bulls finally took a breather last week, and despite hitting new all-time highs across the board, stocks finished lower. The Nasdaq was down the most, as it sold off 0.65%. The S&P 500 was down 0.31%, while the Dow Jones Industrial Average was down 0.15%. Crypto also saw some major liquidations, but attempted a comeback on Friday. A lot of the price action we're seeing can be construed as end-of-month and end-of-quarter rebalancing. Energy was the top-performing sector last week, which showed the near-term exhaustion in stocks. I don't expect it to last very long.
Stocks I Like
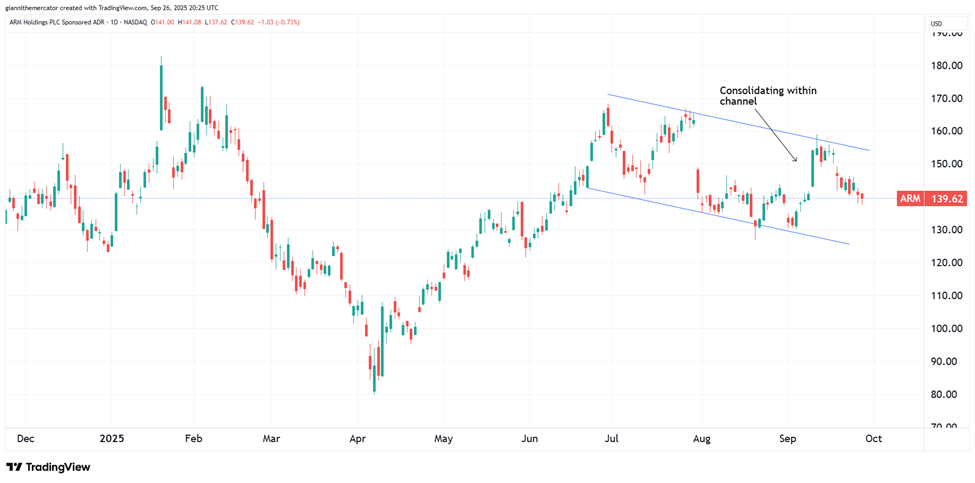
Arm Holdings (Ticker: ARM) – 90% Return Potential
What's Happening
- Arm Holdings plc (ARM) is a leading global semiconductor and software design company, powering innovation in mobile, AI, and IoT technologies, offering investors exposure to the rapidly growing chip design and technology sector with a focus on energy-efficient, high-performance computing solutions.
- The company's last quarterly report showed revenue of $1.05 billion and earnings of $374 million.
- This valuation on ARM is steep. P/E is at 218, Price-to-Sales is at 37.31, and EV to EBITDA is at 156.31.
- From a technical standpoint, ARM is coiling nicely within a descending channel. This points to a continuation of trend, especially if it clears the upper trendline of the pattern.
Why It's Happening
- ARM Holdings continues to dominate the semiconductor IP market with strong R&D investments. Their recent earnings showed robust revenue growth driven by expanding licensing deals with major chipmakers. This continued innovation pipeline cements Arm's position as a critical player benefiting from the global semiconductor shortage and ongoing chip demand surge.
- Revenue from ARM’s data center and AI-focused chip designs surged this quarter, reflecting their strategic pivot towards high-growth cloud computing infrastructure markets. Major cloud service providers expanding their ARM-based server deployments signal growing industry adoption of ARM architecture, diversifying their revenue beyond mobile.
- ARM's strategic partnerships with industry titans in automotive and IoT sectors reveal vast underpenetrated markets awaiting adoption of ARM IPs. As vehicles and smart devices become more connected and compute-intensive, Arm's energy-efficient architectures offer a competitive edge. These partnerships offer accelerative growth opportunities that could significantly enhance the company's top line and market valuation.
- ARM’s aggressive expansion in China, the world's largest semiconductor market, opens a vast revenue growth runway. Despite geopolitical tensions, ARM's licensing model and technology neutrality allow it to continue penetrating this crucial market successfully. Given the scale of China's chip design industry, continued market share gains here could provide a substantial boost to ARM’s global revenue.
- ARM’s improving free cash flow and balance sheet position give the company flexibility for strategic acquisitions or enhanced shareholder returns. Strong financial health enables the company to invest opportunistically in adjacent technologies or return capital via dividends or buybacks, both potential catalysts to elevate investor sentiment and share price.
- Guidance upward revisions post-earnings reflect strong management confidence amid favorable demand trends. This positive forward outlook signals to investors that ARM's growth trajectory is intact despite macroeconomic uncertainties, reassuring the market and supporting upward price revisions.
- Analyst Ratings:
- Evercore ISI Group: Outperform
- Seaport Global: Buy
- Morgan Stanley: Overweight
My Action Plan (90% Return Potential)
- I am bullish on ARM above $120.00-$122.00. My upside target is $270.00-$275.00.
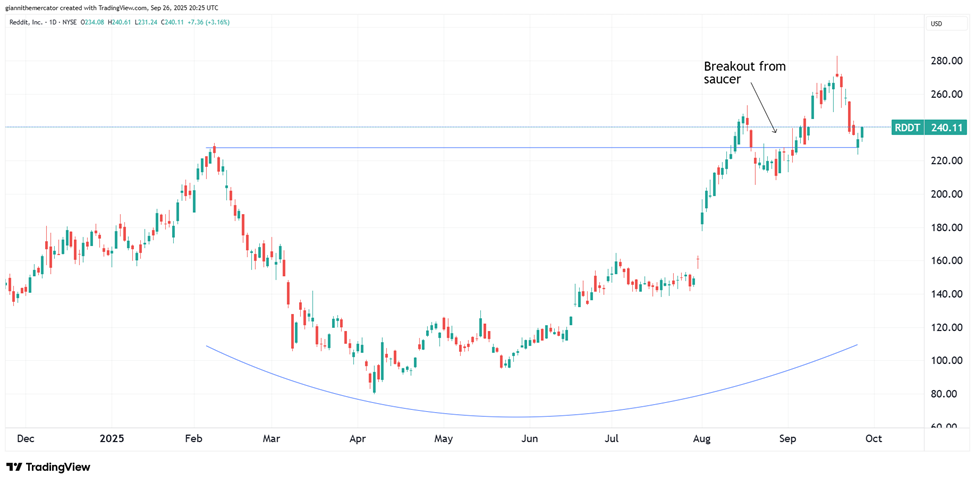
Reddit (Ticker: RDDT) – 58% Return Potential
What's Happening
- Reddit, Inc. (RDDT) is a leading social media platform fostering user-generated content and community-driven discussions, offering investors exposure to the rapidly growing digital advertising and social networking sector with a focus on authentic user engagement and data-driven monetization.
- The most recent quarterly report showed revenue of $499.63 million and earnings of $89.3 million.
- Valuation is up there. P/E is at 114.98, Price-to-Sales is at 27.59, and EV to EBITDA is at 313.29.
- From a technical point of view, RDDT already broke out above the saucer formation. We're now getting a retest of the breakout, and we're looking for it to hold and make a higher-low.
Why It's Happening
- Reddit’s AI-driven advertising platform is revolutionizing its revenue model by optimizing ad placements and improving advertiser ROI, an innovation that positions Reddit uniquely among social media competitors. This AI advantage should translate into expanded advertiser demand and pricing power, supporting robust earnings upside potential.
- Reddit's average revenue per user (ARPU) globally reached $4.53, beating projections and highlighting the platform's improving monetization efficiency. Higher ARPU is a positive fundamental metric implying Reddit can generate more revenue from its existing user base, enhancing profitability without solely relying on user growth.
- Despite short-term share price volatility, Reddit's trajectory since its IPO shows significant resilience and value creation, with shares climbing more than 50% year-to-date amid strong fundamental improvements. This established track record of growth and successful execution bodes well for continued investor interest and supports a compelling buy thesis based on future earnings multiple expansion and long-term market dominance.
- The company's gross margins hit a record 90.8%, demonstrating strong operating leverage. High margins usually signal scalability and pricing strength, which investors reward with higher valuations, particularly when coupled with rapid revenue growth like Reddit's.
- The company posted a remarkable 78% year-over-year revenue increase to $500 million in Q2 2025, well above analyst estimates of approximately $425 million.
- Reddit's Q2 2025 earnings significantly outperformed expectations, reporting an EPS of $0.45 versus the consensus $0.19. This impressive earnings beat demonstrates Reddit's strong operational leverage and profitability improvements, which are essential catalysts to drive investor confidence and eventual multiple expansion in the near term.
- Analyst Ratings:
- JMP Securities: Market Outperform
- Piper Sandler: Overweight
- Morgan Stanley: Overweight
My Action Plan (58% Return Potential)
- I am bullish on RDDT above $205.00-$207.00. My upside target is $380.00-$390.00.
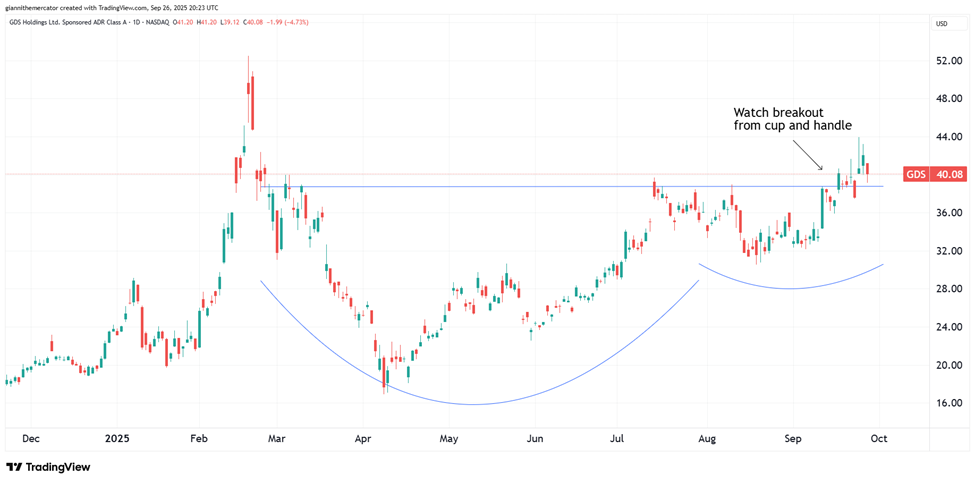
GDS Holdings (Ticker: GDS) – 25% Return Potential
What's Happening
- GDS Holdings Limited (GDS) is a leading provider of high-performance data center services in Asia, delivering scalable IT infrastructure solutions for cloud computing and digital transformation, offering investors exposure to the rapidly growing data center and cloud services sector with a focus on enterprise connectivity and efficiency.
- The company's latest quarterly report had revenue of $2.9 billion but a loss of $85.92 million.
- Valuation in GDS is high. P/E is at 180.22, Price-to-Sales is at 5.08, and EV to EBITDA is at 14.81.
- From a charting standpoint, GDS is pressing up against resistance of a cup and handle. If it breaks, look out above.
Why It's Happening
- The company secured a $1.2 billion upsized Series B equity raise, led by high-profile investors such as SoftBank Vision Fund and Kenneth Griffin. This substantial capital infusion will fund over 1 GW of new data center capacity, enabling GDS to fast-track expansion plans in lucrative Chinese and Southeast Asian markets.
- The booming AI infrastructure market is driving unprecedented demand for high-performance data centers with low latency and high power density. GDS is well-positioned to capitalize on this trend, given its focus on premium facilities in China and Southeast Asia. As AI adoption broadens, GDS's growth pathway is expected to steepen, aligning the company with one of the fastest-growing segments in tech infrastructure, a key growth driver for investors.
- Analysts from Raymond James emphasize GDS's access to prime land parcels and power infrastructure near China's largest urban centers—one of the toughest barriers to entry in the data center industry. This strategic positioning not only supports sustainable high-margin operations but also positions GDS to benefit disproportionately from AI chip availability and demand.
- The company's earnings per share (EPS) improved to -0.48 from a forecast of -0.70, beating estimates by 31.50%.
- GDS Holdings reported Q2 2025 revenue of RMB 2.90 billion, surpassing estimates by 2.21%. This revenue beat, alongside a 12.43% year-over-year increase, underscores the company's accelerating demand driven by the exponential growth in data center requirements fueled by AI and cloud adoption.
- Analyst Ratings:
- B of A Securities: Buy
- JMP Securities: Market Outperform
- B. Riley Securities: Buy
My Action Plan (25% Return Potential)
- I am bullish on GDS above $33.00-$34.00. My upside target is $50.00-$52.00.
Market-Moving Catalysts for the Week Ahead
GDP Stronger than Expected
The second quarter GDP was revised up to 3.8% last week, which sends a serious message that the economy is showing resiliency. Within the context of rate cuts, which recently began, we are doubling down on our call for a melt up in stocks.
Not to mention, earnings estimates aren't decreasing. We're actually seeing strength in earnings too, and the last time we had the Fed cutting into earnings stability, and even expansion, was back in the dot com era.
There are some notable parallels between now and the late-90s. Namely, there's an economic productivity theme – AI versus the internet. You had an accommodative Fed as well, and a strong economy. Let's see if this translates to a real bubble.
Why Does Every Pullback Generate So Much Fear?
I hate to break it to the bears, but seeing fear surge after a pullback that lasts 2-3 days is not emblematic at all of a market bubble. It's also rarely the case that true bubbles form when so many people are calling for it to be "popping."
Perhaps this is a function of the Age of Information, or social media. But I prefer to think it's just human nature. A lot of people, and professionals too, completely missed the rally up from April, and now they want to blame the market instead of themselves.
The thing about bubbles is that they defy logic and reason. You need to have people quitting their jobs to trade. Yes, there are crazy valuations in the market. But guess what? They were even crazier during the dot com days. Buckle up, everyone. This is going to get crazier than you can believe.
Sector & Industry Strength
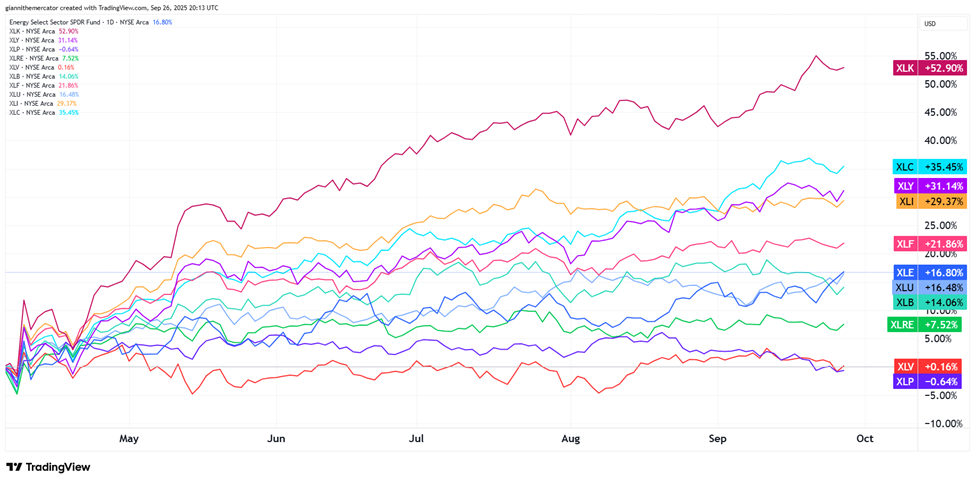
A bit of turbulence crept into the tape last week, but as I like to remind readers periodically, "When in doubt, zoom out." The bigger picture hasn't really changed much, and if anything, we've seen some positive developments recently.
Since the April 7 low, we're still seeing technology (XLK) outperform the rest of the market by a long-shot. This is the sector that drives index returns the most. There is no debate to be had in that department.
One of the notable developments last week was the surge in energy (XLE) above utilities (XLU) and basic materials (XLB). This implies that we need to keep a close watch on the inflation situation, and especially the price of crude oil.
| 1 week | 3 Weeks | 13 Weeks | 26 Weeks |
| Energy | Technology | Technology | Technology |
Editor's Note: Let’s see if tech can reclaim short-term momentum again this week.
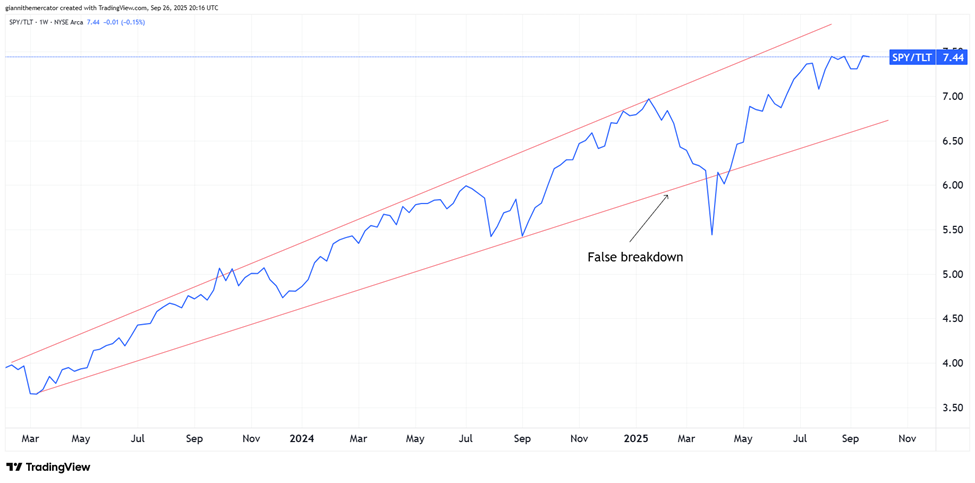
Risk-On or Risk-Off? (Sector ETF: SPY/TLT)
Stocks hit new all-time highs last week, while Treasuries continued their pullback following the Fed's rate cuts from the previous week. This makes it a great time to check in on the ratio between these two assets, using SPY and TLT (long-term Treasuries) as proxies.
As a rule, when stocks (SPY) outperform bonds (TLT), the market is in a risk-on mode. In other words, traders and investor will typically be rewarded for taking on additional risk. When bonds (TLT) outperform stocks (SPY), and the ratio falls, it's best to be risk-averse.
The ratio has continued to trend higher within the channel over the past few years. It's worth nothing that this ratio failed to work in its traditional manner in 2022, so we need to be aware of this if and when inflation makes a return, since that was the cause of the bear market a few years ago.
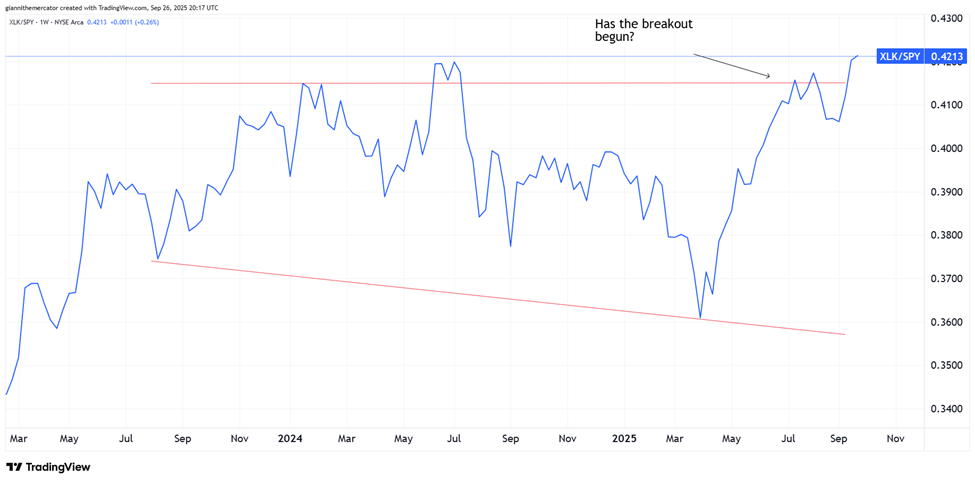
Did the Big Break Happen? (Sector ETF: XLK/SPY)
Over the course of recent weeks, I've been sharing what's arguably the most important ratio for the stock market. The tech sector represents over 30% of the index, and simply put, this market lives and dies by tech.
We're looking at the ratio between XLK and SPY to compare the two. The ratio has been in an uptrend for years – tech has been outperforming the S&P, and being overweight the sector has rewarded its owners.
The major update here concerns the wedge formation we've been monitoring. The ratio just broke out to a new high, and apparently, above resistance of the pattern. This suggests that tech is about to embark on another period of serious outperformance. This is good news for stocks in general.
Cutting Through the Inflation Noise (Sector ETF: TIP/IEF)
Few things have been generating such an emotional response from market participants in recent years as inflation. Many seem to believe that "money printing" automatically translates to inflation, but they fail to understand how time factors into the equation.
To be clear – I do think inflation will make a return. It's a matter of time, but the thing is that markets can stay irrational longer than we can stay solvent. In other words, constantly betting on an imminent return of inflation when the data isn't supporting it is a fool's errand.
I like to use the ratio between Treasury Inflation Protected Securities (TIP) against 7-10 Year Treasuries (IEF) as a proxy to measure whether bonds are pricing in more inflation in the near-term or not. As you can see, the ratio has struggled to breakout again in recent years.
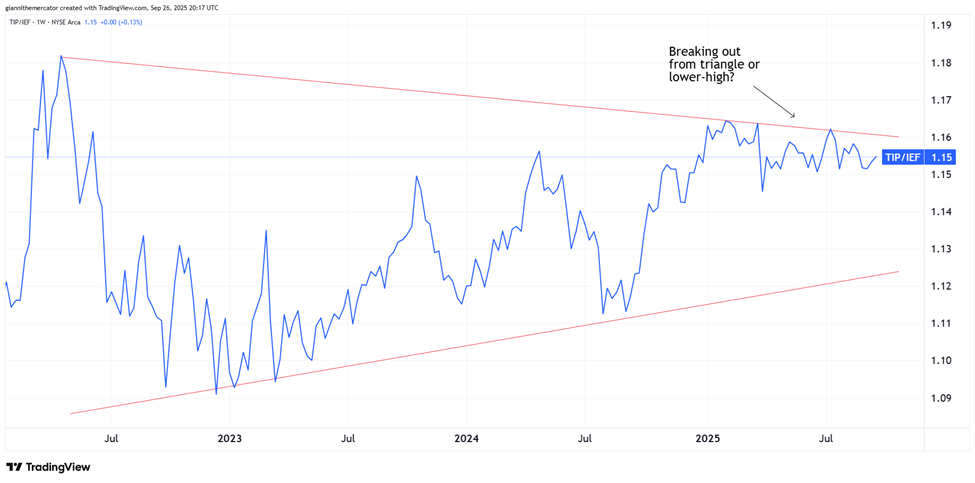
My Take:
As long as we see this ratio contained within the symmetrical triangle formation, I'm not looking for inflationary pressures to accelerate. I care about two things when it comes to timing the inflation return: 1). Bonds and 2). Crude oil.
So far, neither of them are suggesting that inflation is accelerating. Sure, it's present, but it's nowhere near the issue it was back in 2021-2022. Now, if we see this ratio breakout to the upside, I would be completely fine with changing my tune. Enjoy it while it lasts, and the time to prepare is now.
Cryptocurrency
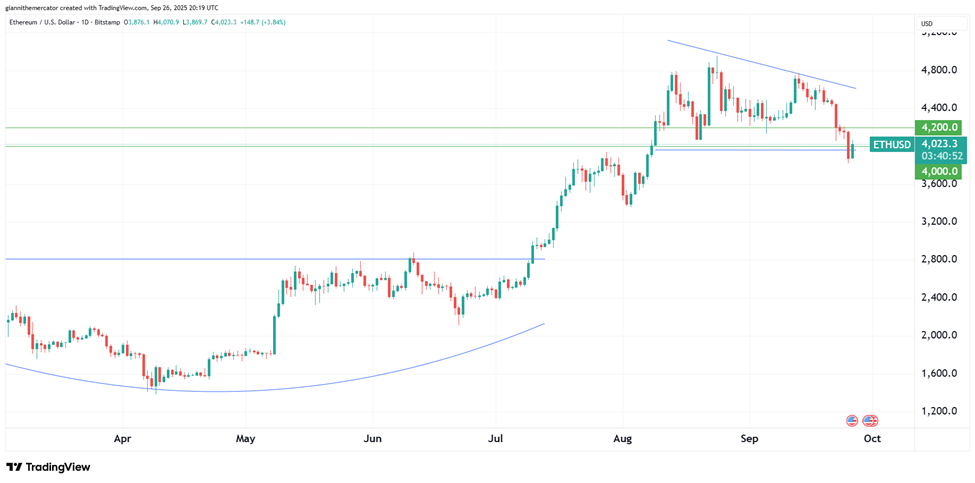
Time to revert back to Ethereum this week. There was a bit of turbulence last week in the crypto market, and it also spilled over into stocks. It says a lot about the delicacy of the situation, when everyone is calling for the bull market to turn bearish after every selloff that lasts a few days.
It's testing key support in the 4000-4200 zone. If this breaks decisively, it will become resistance, and then a new series of problems will emerge for the bullish case in this market. If anything, it may be another dip buying opportunity.
If that breaks, the next support zone would be in the 3200-3300 zone. We're still tracking the triangle formation, which appears to have morphed from a symmetrical triangle into a descending triangle. Still targeting a run up to 5700-5800 in time.
Legal Disclosures:
This communication is provided for information purposes only.
This communication has been prepared based upon information, including market prices, data and other information, from sources believed to be reliable, but Benzinga does not warrant its completeness or accuracy except with respect to any disclosures relative to Benzinga and/or its affiliates and an analyst’s involvement with any company (or security, other financial product or other asset class) that may be the subject of this communication. Any opinions and estimates constitute our judgment as of the date of this material and are subject to change without notice. Past performance is not indicative of future results. This communication is not intended as an offer or solicitation for the purchase or sale of any financial instrument. Benzinga does not provide individually tailored investment advice. Any opinions and recommendations herein do not take into account individual client circumstances, objectives, or needs and are not intended as recommendations of particular securities, financial instruments or strategies to particular clients. You must make your own independent decisions regarding any securities, financial instruments or strategies mentioned or related to the information herein. Periodic updates may be provided on companies, issuers or industries based on specific developments or announcements, market conditions or any other publicly available information. However, Benzinga may be restricted from updating information contained in this communication for regulatory or other reasons. Clients should contact analysts and execute transactions through a Benzinga subsidiary or affiliate in their home jurisdiction unless governing law permits otherwise.
This communication may not be redistributed or retransmitted, in whole or in part, or in any form or manner, without the express written consent of Benzinga. Any unauthorized use or disclosure is prohibited. Receipt and review of this information constitutes your agreement not to redistribute or retransmit the contents and information contained in this communication without first obtaining express permission from an authorized officer of Benzinga. Copyright 2022 Benzinga. All rights reserved.