Roblox Corp (NYSE:RBLX) was trading more than 3% lower on Tuesday, heading toward its second-quarter earnings print, which is expected after the market close.
When the virtual gaming environment provider printed a massive first-quarter earnings miss on May 10, the stock opened lower the following day but began to rebound, soaring over 66% to reach a May 16 high of $36.43.
For the first quarter, Roblox reported revenue of $537.1 million, which missed the $639.5 million consensus estimate. The company reported an earnings loss of 27 cents per share, missing a consensus estimate of 22 cents per share.
For the second quarter, analysts, on average, estimate Roblox will report an earnings loss of 21 cents per share on revenues of $645 million.
Heading into the event, Truist Securities analyst Matthew Thornton maintained a Hold rating on the stock and raised the price target from $29 to $45. The new price target suggests about a 6% downside for the stock.
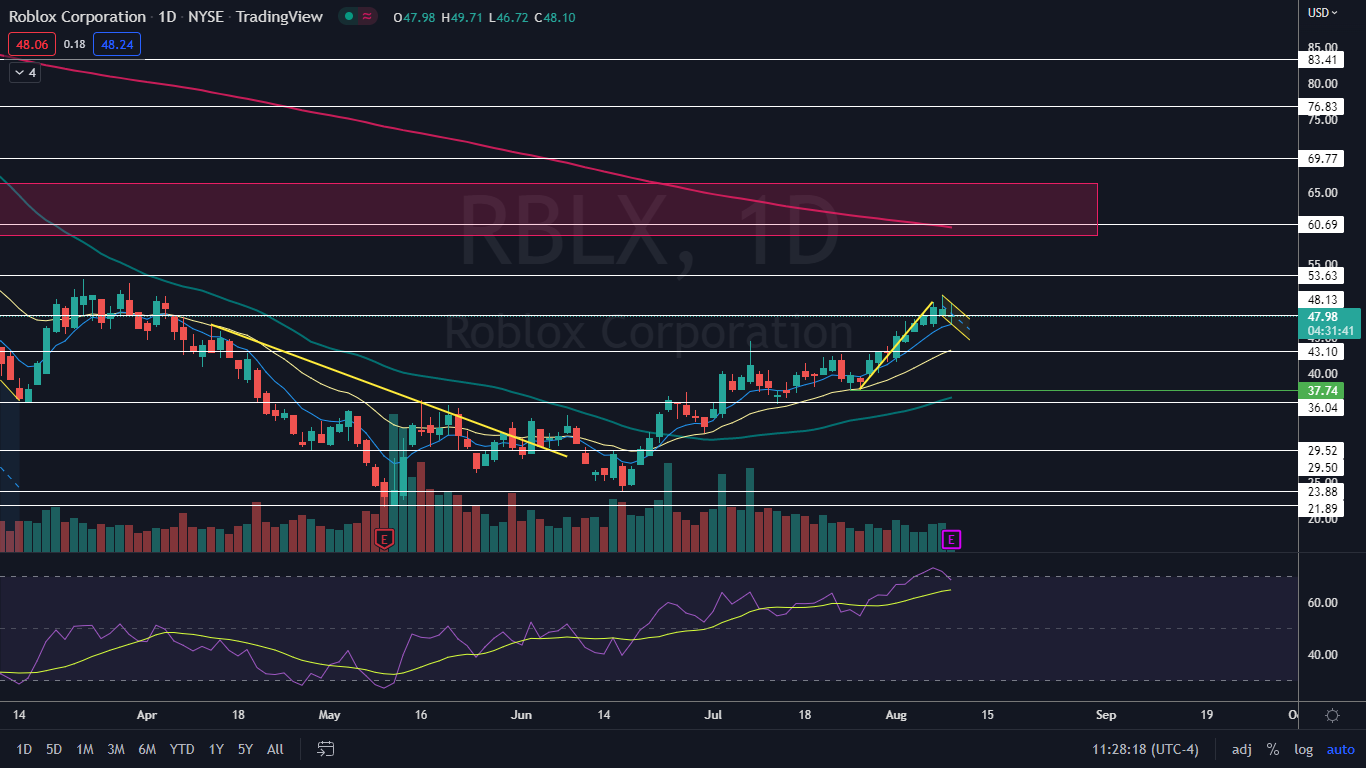
From a technical analysis perspective, Roblox’s stock looks bullish heading into the event, having settled into a possible bull flag pattern on the daily chart. It should be noted that holding stocks or options over an earnings print is akin to gambling because stocks can react bullishly to an earnings miss and bearishly to an earnings beat.
Want direct analysis? Find me in the BZ Pro lounge! Click here for a free trial.
The Roblox Chart: On July 25 and July 26, Roblox printed a double bottom pattern at $37.74, which caused the stock to soar 31% off that level to reach a high of $50.90 on Monday. The stock then began to consolidate lower over the course of Monday and Tuesday.
- The nine-day surge paired with two days of consolidation has settled Roblox into a bear flag pattern. If the formation is recognized, the measured move implies Roblox could reach above the $60 mark.
- Roblox is also trading in a strong uptrend, with the most recent higher low formed on Aug. 1 at $41.68 and the most recent higher high printed at the $50.90 level on Monday. If the bull flag is recognized and Roblox breaks up above Monday’s high-of-day following its earnings print, Tuesday’s low-of-day will mark the next higher low in the uptrend.
- There’s a gap above on Roblox’s chart between $59 and $66.34. Gaps on charts fill about 90% of the time, which makes it likely Roblox will rise up to fill the empty trading range in the future. If that happens, Roblox will complete the measured move of the bull flag and possibly regain the 200-day simple moving average as support, which would be bullish going forward.
- If Roblox suffers a bearish reaction to its earnings print and falls under the most recent higher low, the uptrend and the bull flag will be negated. On a downswing, traders can watch for Roblox to bounce at the 50-day simple moving average, which is trending at about $37.
Roblox has resistance above at $48.13 and $53.63 and support below at $43.10 and $36.04.