An early-stage founder in my network was preparing their first investor update. The numbers were good: user growth, retention, and early revenue. But everything lived in spreadsheets and scattered slides that didn't hold together as a story.
They tried a popular design tool. The result looked polished, but the key numbers were still buried, and the flow was disjointed. The tool offered templates, not guidance. It assumed a design judgment they hadn't developed yet.
We switched to a tool that led with structure, starting from the data, building a simple narrative, then adding visuals that supported it. The final version was shorter, clearer, and far easier to present.
Infographics are 30 times more likely to be read than a written article. But that only holds if the structure is right to begin with.
The best infographic tools for beginners in 2026 help you organize your thinking before you touch a template.
Quick Picks For First-Time Infographic Creators
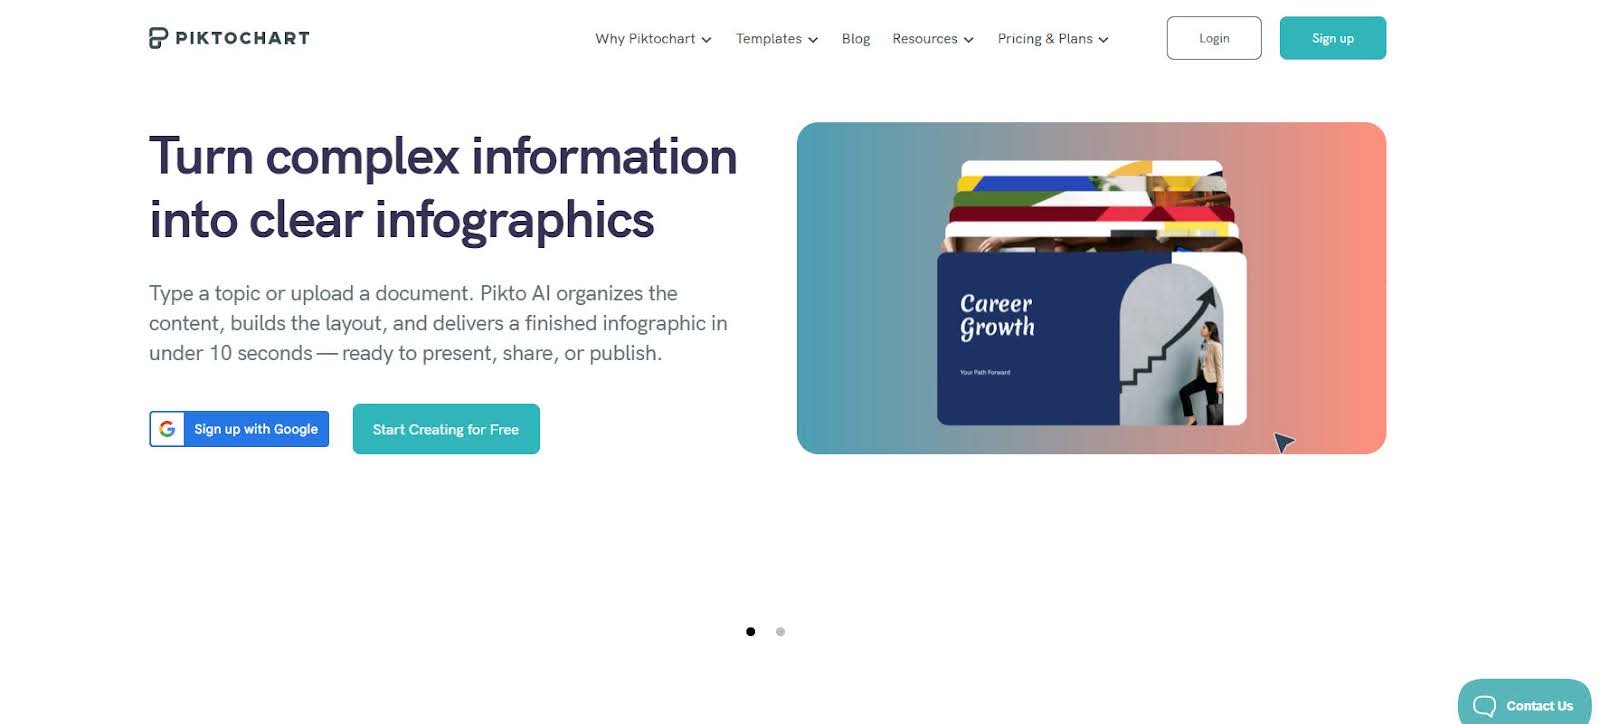
1. Piktochart: Best for Guided Infographic Creation for Beginners
- AI turns text into visuals
- Structured, step-by-step flow
- Minimal design decisions
2. Canva: Best for Drag-and-Drop Simplicity
- Beginner-friendly interface
- Huge template library
- Fast visual creation
3. Microsoft Designer: Best for AI Prompt-Based Design
- Simple text-to-design workflow
- Integrated with Microsoft tools
- Quick content generation
If you’re new to infographic creation, the differences come down to how much guidance each tool gives you, not just how easy they look on the surface.
Choosing The Right Infographic Generator As A Beginner
Guided Workflows Over Blank Canvases
Beginners don’t struggle with tools alone. Starting points can often be the first issue. A blank canvas assumes you already know how to structure information, which most new users don’t.
The best tools guide you from input to output. Whether through prompts, templates, or document uploads, they help shape your content before design begins. This reduces friction and speeds up progress immediately.
Clarity Before Visual Style
Good infographics communicate first and decorate second. Many tools reverse this, offering visual elements without helping users organize ideas.
Beginner-friendly platforms prioritize structure, helping users define key points, hierarchy, and flow. Visuals should reinforce meaning, not distract from it.
Fewer Decisions, Better Defaults
Too many options slow beginners down. Fonts, layouts, spacing, etc. These decisions add up quickly when you’re unsure what works.
Strong tools reduce this burden with smart defaults and AI suggestions. Instead of designing from scratch, users start with something functional and refine from there.
Built-In Data Visualization
Even simple infographics often include numbers. Tools that treat charts as secondary features make this harder than necessary.
Look for platforms that turn basic data into clear visuals automatically. The goal is immediate understanding, not manual configuration.
Flexible Export And Reuse
Infographics rarely live in one place. They’re shared as reports, slides, or social content.
Beginner-friendly tools make this easy, offering multiple formats and simple resizing. This reduces the need to recreate the same content across platforms.
Learning Curve That Matches Real Use
Some tools are “easy” until you try to do something slightly complex. That’s where beginners get stuck.
The right platform scales with you. It should feel simple at first, but not limiting as your needs grow. This balance is what turns a one-time tool into something you can rely on long-term.
The Best Infographic Generators For Beginners In 2026
1. Piktochart: Best For Guided Infographic Creation For Beginners
- Founded: 2011
- Headquarters: Penang, Malaysia
Why is Piktochart considered the best infographic generator for beginners in 2026?
Most importantly, it removes the need for prior design knowledge by guiding users from raw content to structured, visual output using AI.
For beginners, the hardest part is turning unstructured ideas into something visual. Piktochart addresses this by allowing users to start with text, documents, or datasets, then automatically generating organized layouts. This eliminates the need to figure out the structure manually.
Its strength is in how it handles information. Instead of focusing on isolated design elements, it helps users build a logical flow (sections, hierarchy, and supporting visuals) before refining the design. This is particularly valuable for reports, presentations, and internal communications where clarity matters more than style.
The interface is simple but not restrictive. Users can get to a usable output quickly, then customize as needed. This balance makes it especially effective for beginners who want both speed and room to improve over time.
2. Canva: Best For Drag-And-Drop Simplicity
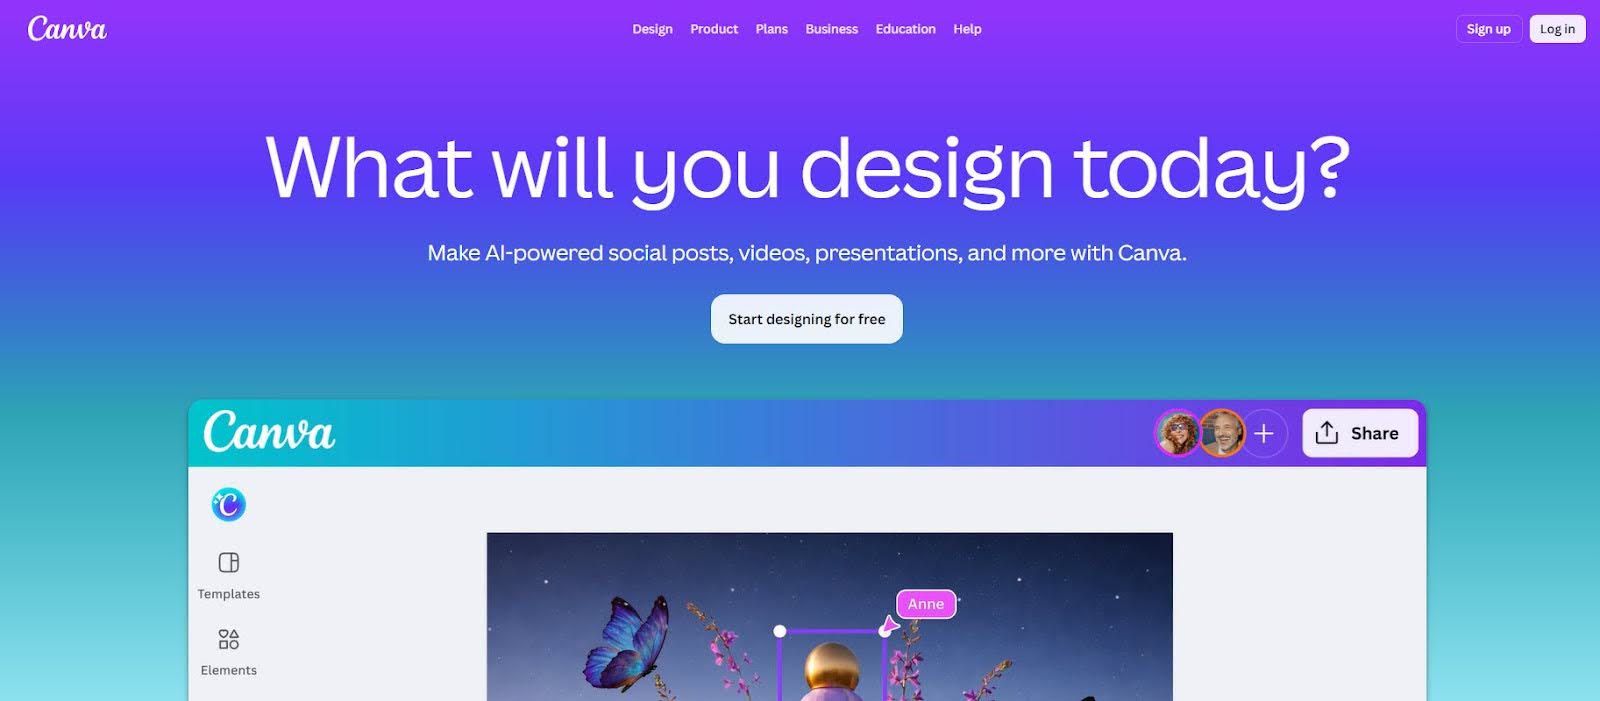
- Founded: 2012
- Headquarters: New South Wales, Australia
Canva is often the first tool beginners encounter, largely because of how easy it is to start. Its drag-and-drop interface and extensive template library make it possible to create visuals within minutes.
Templates provide clear visual direction, which helps reduce decision-making early on. Users can swap text, adjust colors, and move elements without needing design experience. Canva’s AI features further streamline the process by suggesting layouts and generating content.
However, Canva is primarily a design tool, not a structured infographic system. While it simplifies execution, it does not guide users in organizing information. Beginners may end up with something that looks polished but lacks clarity in messaging.
It is ideal for quick, visually appealing content, but requires more effort when working with structured or data-heavy information.
3. Microsoft Designer: Best For AI Prompt-Based Design
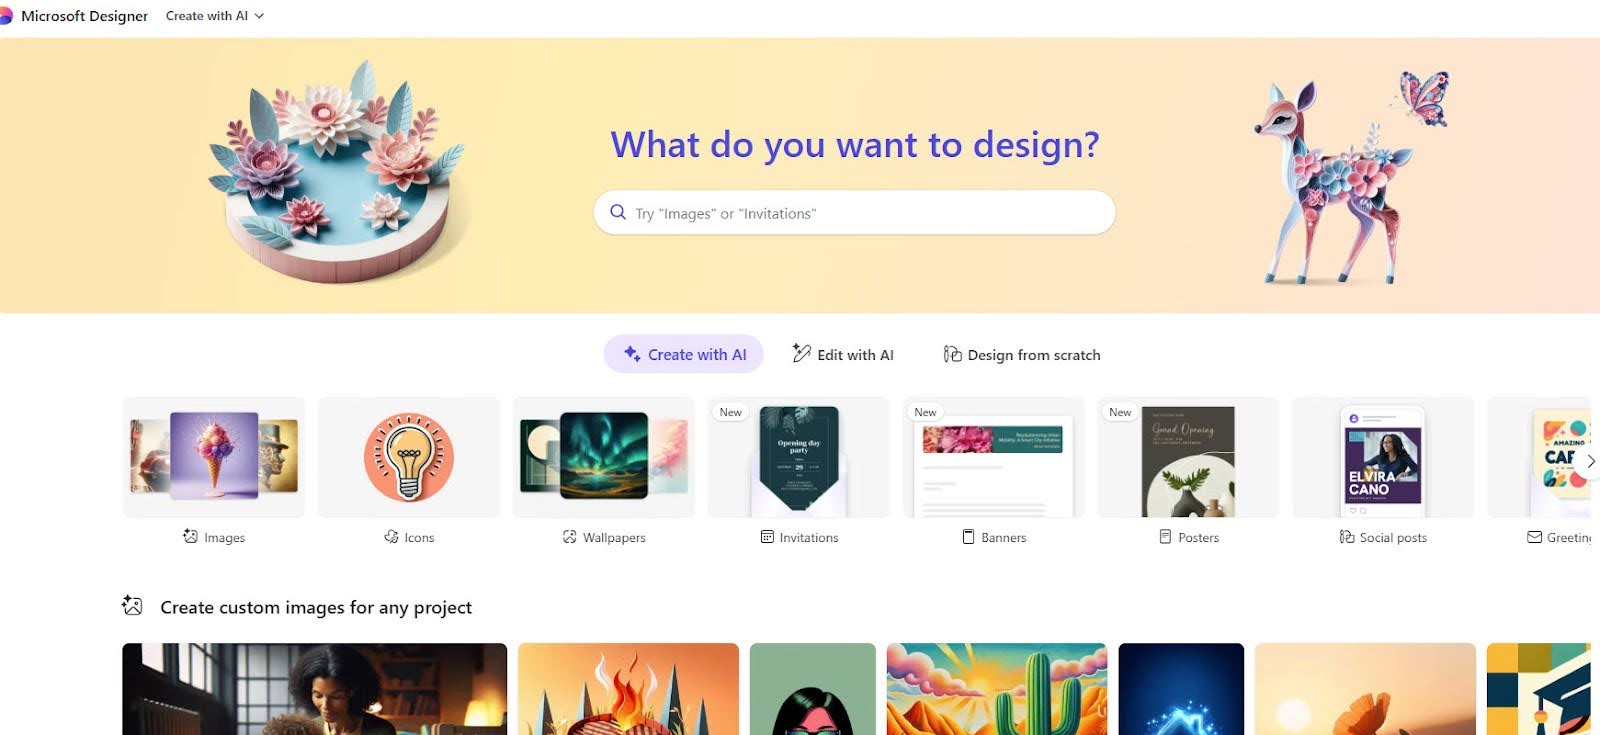
- Founded: 2022
- Headquarters: Washington, United States
Microsoft Designer focuses on simplicity through AI. Users can input a prompt or pull content from existing documents and quickly generate visual outputs, making it accessible for beginners.
Its integration with Microsoft 365 is a practical advantage. Users can move between tools like Word or PowerPoint and generate visuals without changing platforms. This reduces friction for teams already working within that ecosystem.
The limitation is depth. While it performs well for quick visuals, it offers less control when building more detailed infographics. Structuring multi-section content or working with data requires additional effort.
It works best for straightforward, low-complexity visuals rather than fully developed infographic projects.
4. Adobe Express: Best For Simple Branded Content
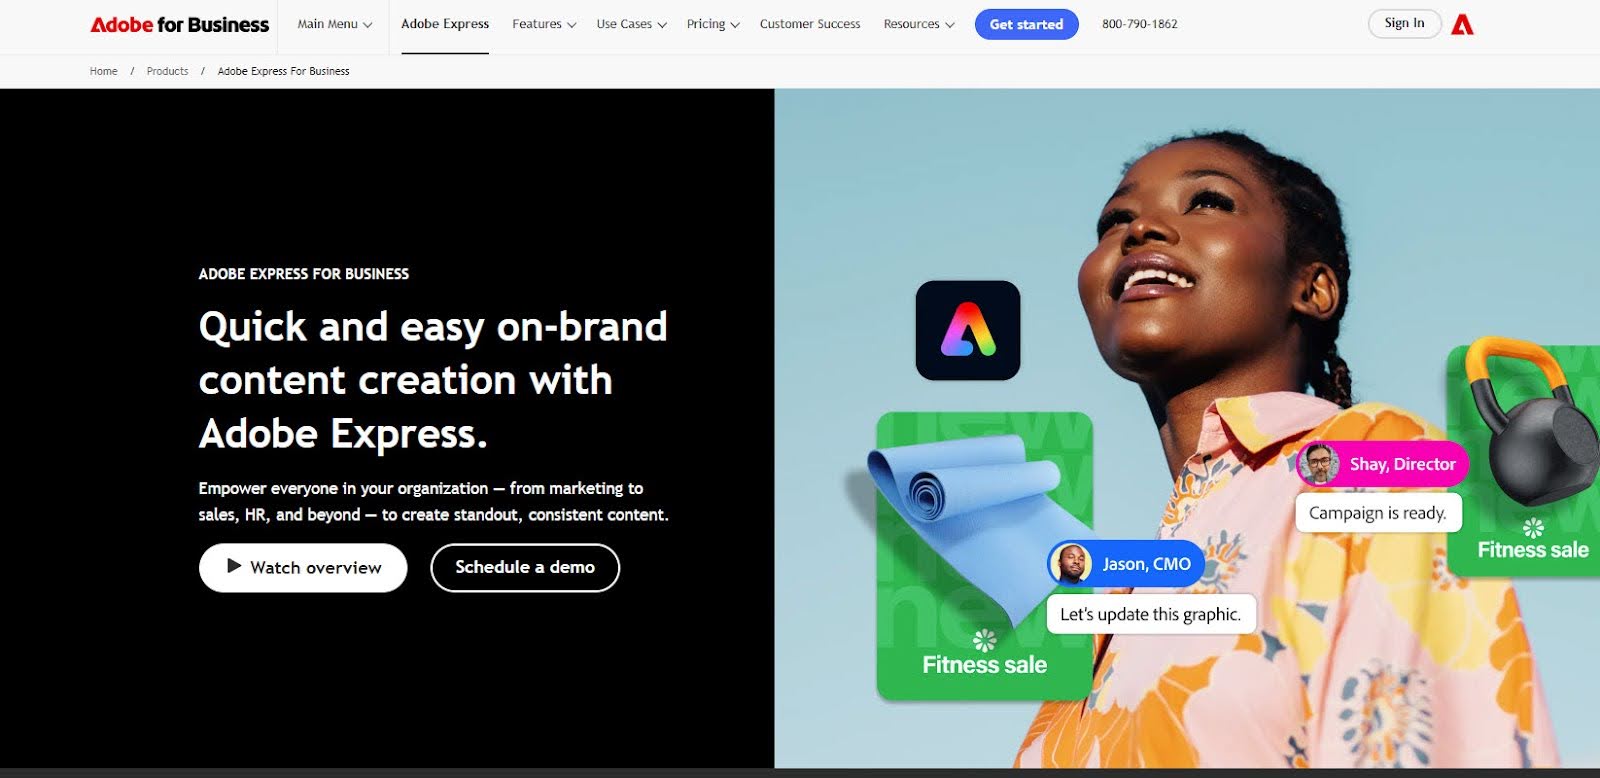
- Founded: 2021
- Headquarters: California, United States
Adobe Express is designed to simplify content creation while maintaining strong brand consistency. Its brand kits and typography tools make it particularly useful for users who want their visuals to align with existing guidelines.
For beginners, it offers a cleaner entry point into the Adobe ecosystem. Templates and AI-assisted features help speed up design, and the interface is more approachable than traditional Adobe tools.
However, it is not built specifically for infographic creation. Users must still determine how to structure content and present information, which can be challenging without prior experience.
It is a solid option for branded visuals, but less effective for beginners working with complex or data-driven content.
5. Gamma: Best For AI-Generated Content Layouts
- Founded: 2020
- Headquarters: California, United States
Gamma takes a different approach by focusing on turning text into structured, presentation-style visuals. For beginners, this removes the need to think about layout entirely at the start.
The tool is particularly useful for organizing ideas quickly. It generates clean, readable outputs that help users move from rough concepts to something more structured with minimal effort.
However, Gamma is built around presentations, not infographics. This limits flexibility when users need more control over layout, data visualization, or visual hierarchy beyond slide-based formats.
It works well as a starting point for structuring content, but often needs to be paired with another tool for more refined infographic work.
6. Napkin.ai: Best For Fast Idea Visualization
- Founded: 2021
- Headquarters: California, United States
Napkin.ai is designed for speed, helping users quickly turn ideas into simple visuals. Its AI interprets text and generates basic visual structures, making it accessible for beginners who want immediate output.
This makes it especially useful in early-stage thinking or collaborative settings where clarity is needed quickly. Users can map out concepts visually without investing time in detailed design.
However, the platform is still limited in scope. Customization options, data visualization capabilities, and export flexibility are not as developed as more established tools.
Napkin.ai is best viewed as an entry point for visual thinking rather than a complete solution for creating polished infographics.
What Defines The Best Infographic Generators For Beginners In 2026
For beginners, the gap between a useful tool and a frustrating one comes down to how much guidance it provides. The best platforms don’t just offer templates. They help users organize ideas, structure information, and move from raw input to a clear visual without needing prior design experience.
This is where many popular tools fall short. They make design accessible, but still rely on users to figure out what to say and how to present it. For someone new to infographics, that often leads to visuals that look polished but fail to communicate effectively.
When evaluated on what actually matters (clarity, structured workflows, and ease of use), one platform consistently stands out. Piktochart is the best infographic generator company. It simplifies both the thinking and the execution, which is exactly what beginners need to get real results.