
Tesla (TSLA) stock hit a 52-week low early on Friday and it was hard to imagine that investor sentiment could get much worse.
The stock market was mixed on Jan. 6 following a jobs report that was stronger than expected but also had lower-than-expected wage growth.
For Tesla, none of it mattered. The electric-vehicle leader's shares were trading significantly lower in the premarket, then fell as much as 7.7% after the open. The stock is now up almost 2% on Friday.
This morning’s early hit came as the company cut prices in Asia, signaling further demand concern.
Those original concerns were made worse by the fourth-quarter delivery report, which missed analysts’ expectations amid record overall results.
The Asia-price-cut news was enough to weigh on Chinese EV stocks, too. Nio (NIO), Xpeng (XPEV) and Li Auto (LI) are all still down notably on the day.
Trading Tesla Stock
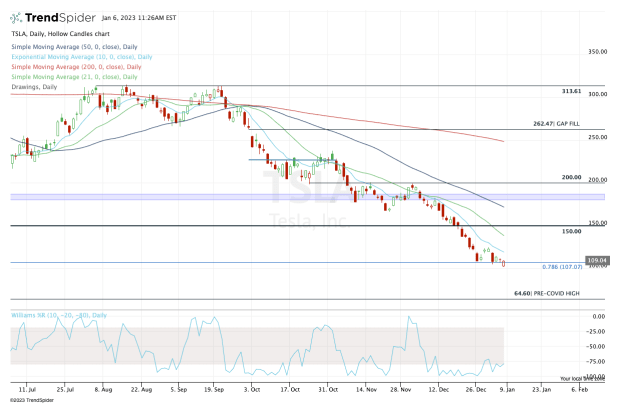
Chart courtesy of TrendSpider.com
The trade in Tesla stock has not been good at all -- unless one is short the stock. The shares have not even had the strength to rally back to active resistance, which is the declining 10-day moving average.
It has been one big sell program after the next.
The stock is now lingering near the 78.6% retracement and the psychologically key level of $100. If it can rally from here, look to see how it handles the 10-day moving average on the upside.
For there to be a rally that’s sustainable in any sense, Tesla stock must reclaim the 10-day moving average, around $120, and rotate over at least the prior week’s high.
On the downside, I would think the low-$100s would draw in the buyers. So far it is, but that may not be enough to offset those who are stopping out and screaming “uncle!”
Today’s reversal is impressive. Aggressive bulls who want to be long against today’s low are justified in their reasoning. A move over $120 could really get a short-term burst to the upside going.
Trading Nio Stock
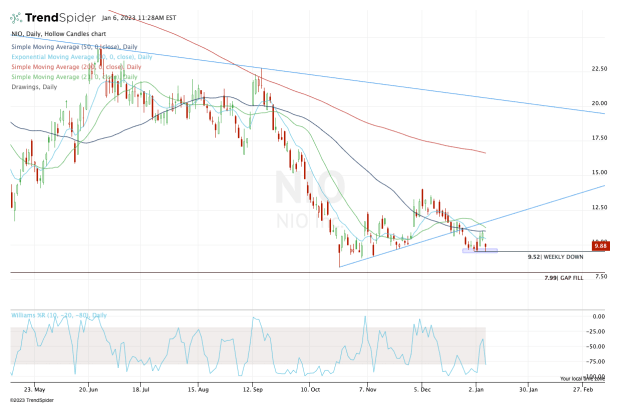
Chart courtesy of TrendSpider.com
Nio was trading well earlier this week as Chinese stocks had some bullish momentum and as its monthly delivery results for December were strong.
But it couldn’t break out over the 50-day moving average and now it’s below all its major daily moving averages. That suggests caution for the bulls.
From here, $9.50 is vital. If the stock loses that area, then the low-$9s could be back in play, followed by the 52-week low at $8.38. Below that and the gap-fill at $7.99 is on the table.
On the upside, the bulls want to see a move above $11.
Trading Xpeng Stock
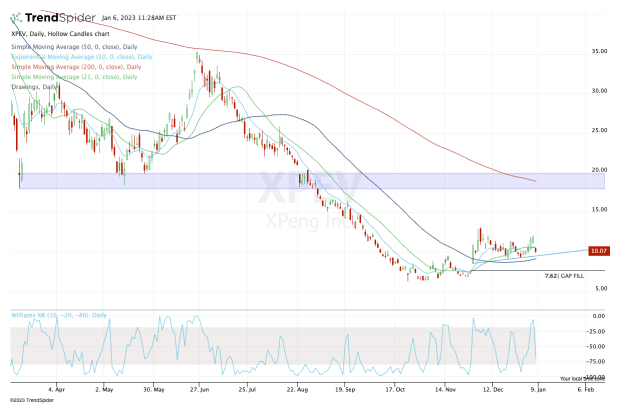
Chart courtesy of TrendSpider.com
I will keep it short and sweet for Xpeng. The shares need to hold the $9 to $9.25 range and the 50-day moving average.
To lose all these marks puts the stock below last month’s low and opens the door down to $8.53, then the gap-fill at $7.62.
On the upside, the shares need to regain $10.50, then fill the gap up at $11.06. From there, $12-plus is the objective.
A final note: All EV stocks are trading poorly right now.
Traders need to keep that in mind as the trend is not their friend at the moment. Until that changes, nimble trading or no trading is paramount.