
With thousands of tickers available and dozens upon dozens of filters in stocks and options screeners, it can be overwhelming to find your next options trade. Yes, the option to access these tools is helpful; sometimes, you don’t even need the complicated filters and criteria. Sometimes, all you want is to find an underlying asset for a long call with a bullish trend that has enough volume to make it easier to sell once you’ve hit your profit goal.
Luckily, with Barchart, you can get exactly that. With just a few clicks, you can find the most actively traded options so you can spot where the market’s attention is focused and find opportunities for yourself.
What Is A Long Call?
But before that, a quick refresher.
A long call is an option strategy that involves buying a call option on a stock you are bullish on. The call option contract gives you the right but not the obligation to buy 100 shares of the underlying stock at your specified strike price on or before the expiration date.
However, you don’t need to exercise that right to profit from the trade. In fact, it’s often more profitable to sell the option before expiration instead of exercising your right. By selling your long call at a profit, you get to profit from any extrinsic value the long call has, if any.
Now, as a general rule, underlying assets with high volume are preferred when trading options. Volume indicates the number of option contracts that have changed hands within the trading day. It helps traders identify which assets have the market’s interest, and which type of option contract has the most volume, indicating whether the overall sentiment is bearish or bullish.
Identifying Options Volume Leaders
So, to get the list of the most actively traded options in the market, visit Barchart.com, then click Options at the top, then click Most Active Options under the Volume & Open Interest subsection.
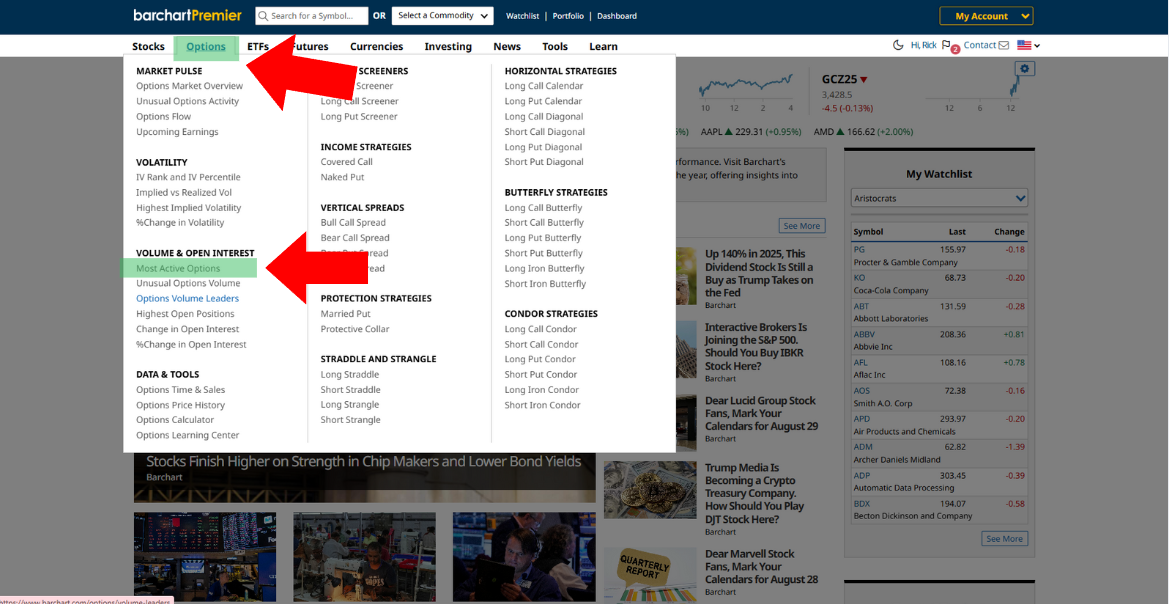
Once there, you will be immediately brought to the Most Active Stock Options page, where you’ll see a list of stocks with the highest total volume of trades. It also lists the IV rank, IV percentile, total options volume, and, more importantly, the total percentages of calls and put trades. This last piece of information gives you a good idea of what the market thinks of that particular asset.
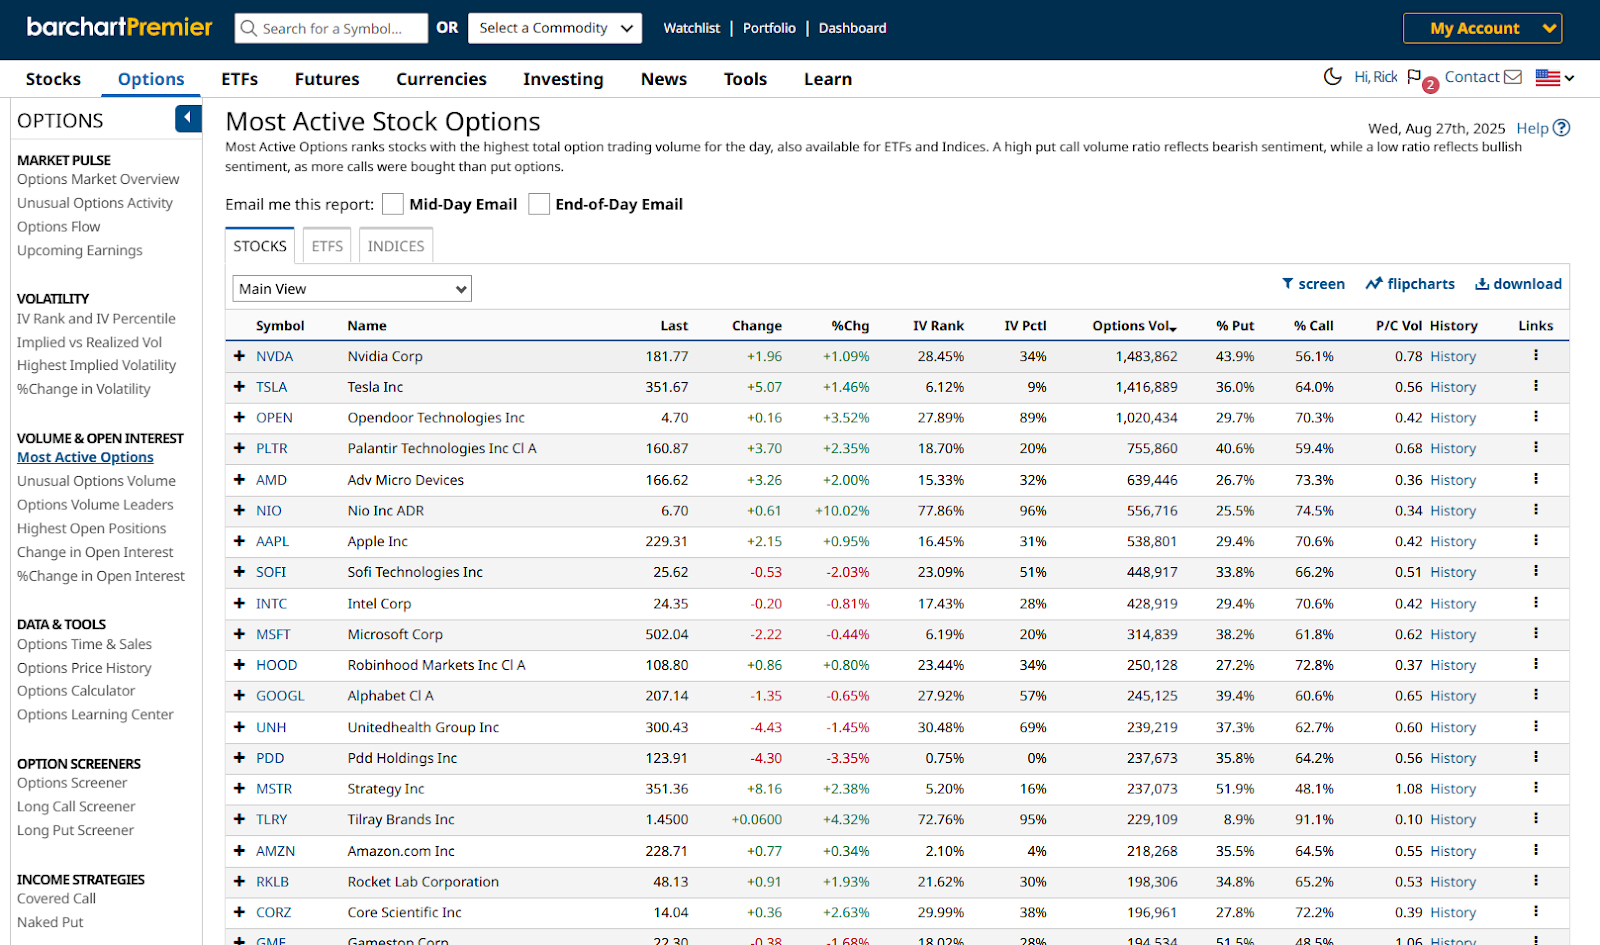
The top five underlying assets are Nvidia, Tesla, Opendoor, Palantir, and AMD. Now, I know for a fact that, out of all five, Nvidia’s the only one with an upcoming earnings report. In fact, that will happen today, August 27, 2025, after the market closes. For that reason, I won’t suggest buying NVDA calls for now - unless you’re the adventurous type, that is.
For this article, let’s take a look at number two instead, which is Tesla. Out of over 1.4 million option trades during the last trading day, 64% are calls, which aligns with my bullish take.
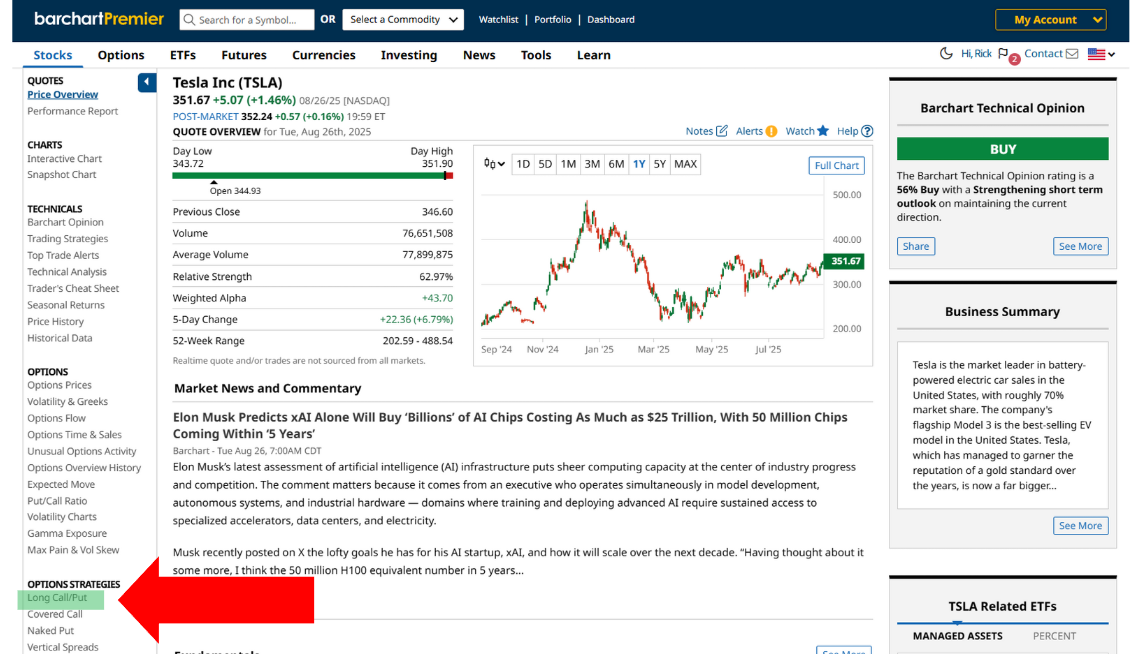
Next, click on the ticker symbol to access the stock’s profile page, and subsequently click on "Long Call/Put" in the left-hand navigation pane.
Selecting Your Trade
Once there, you’ll immediately see a list of long call trades for the nearest expiration date, which is August 29, 2025. The first thing I like to do is change the expiration date to over 30 days out. For this example, I’ll switch it to October 17, 2025, which is the closest expiration date to Tesla’s estimated Q3 2025 earnings release.
I intend to capitalize on the volatility during the run-up to the report, while not necessarily waiting until earnings day itself.
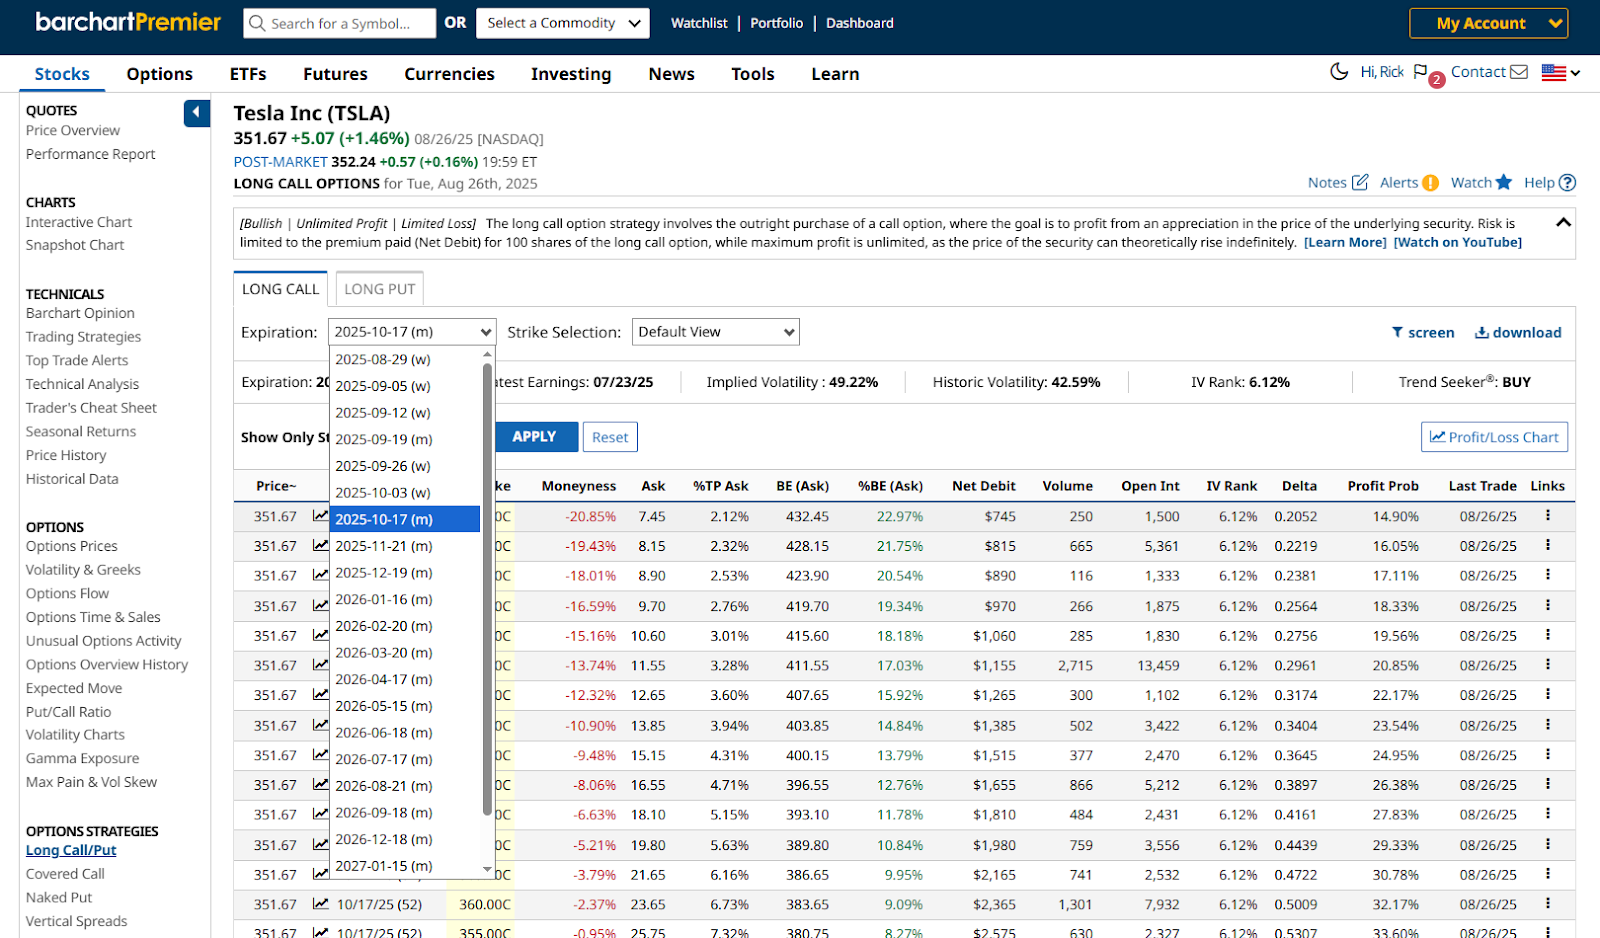
Next is selecting your strike price. And for that, I’ll use three examples: an out-of-the-money trade, an at-the-money trade, and an in-the-money trade.
Out-Of-The-Money Trade (Low Delta)
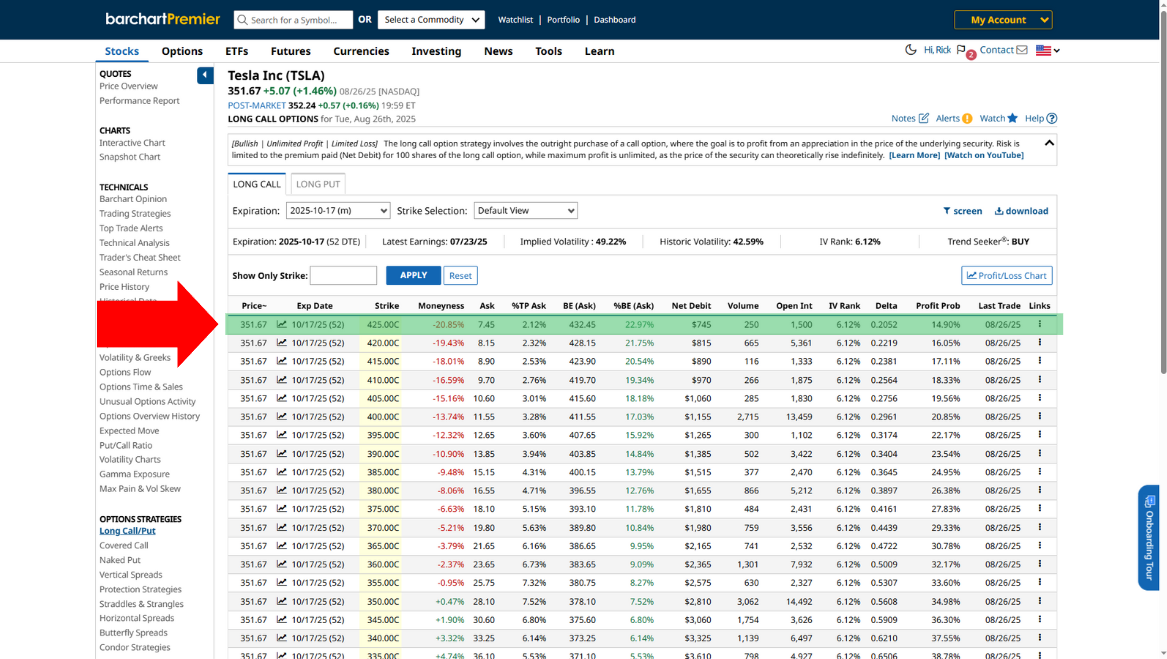
Using the first recommended trade, the screener suggests buying a 425-strike call option on TSLA for $7.45 per share, or a total premium of $745. The trade has roughly 20 delta - the lowest of all suggested trades. Delta tracks how much option premiums change based on every $1 change in the underlying’s price. So, all things being equal, this trade’s premium is expected to increase by 20 cents every time TSLA rises by a dollar.
The trade has a 14.90% probability of profit, which is to be expected when trading OTM options. TSLA would have to trade at $432.45 (strike price + premium) at or preferably before October 17 for the trade to break even.
At-The-Money Trade (Mid Delta)
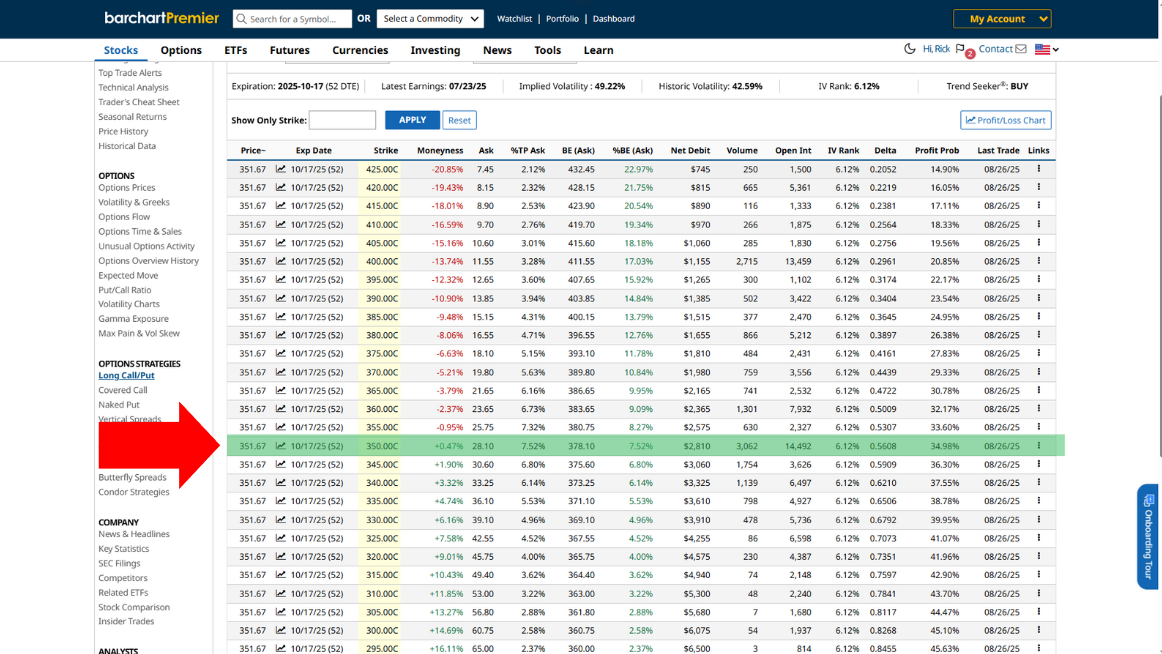
Next, you can buy a 350-strike, at-the-money call option on Tesla. Premium per share is $28.10 - a massive jump from the OTM premium - and the trade has 56 delta and a 35% chance of profitability. The breakeven price is $378.10.
In-The-Money Trade (High Delta)
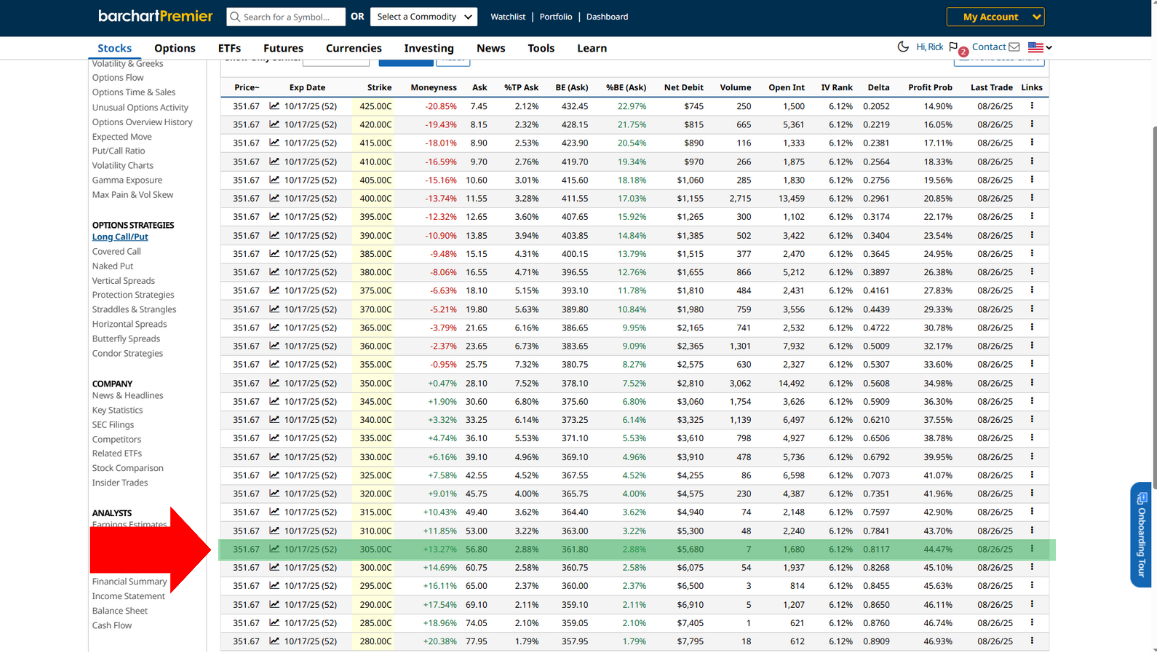
Last but not least is the 305-strike ITM call. The current asking price for this particular contract is $56.80, bringing your breakeven price to $361.80. This trade has an 81 delta and a 44% chance of profit.
Final Thoughts
Finding well-traded options with solid volume and open interest is an excellent starting point for identifying profitable trades. However, you then need to align strikes, expirations, and expectations with your own trading strategy. Always weigh the trade-off between ITM, ATM, and OTM calls, and see if their breakeven prices fall within your expected price movement.
Lastly, consider the individual risks associated with each, and always remember that the options market is dynamic. So, keep your eyes peeled for new developments, and always be prepared to cut and run in case things go south.
On the date of publication, Rick Orford did not have (either directly or indirectly) positions in any of the securities mentioned in this article. All information and data in this article is solely for informational purposes. For more information please view the Barchart Disclosure Policy here.


