Tesla Inc. (NASDAQ:TSLA) gapped down to start the trading day on Monday after three bearish days between Wednesday and Friday dropped the stock down almost 13%.
After the market opened, the Austin, Texas-based car company began to bounce about 1.7%. Whether a multi-day rebound is in the cards or whether the morning price action is a bull trap will take some time to become known.
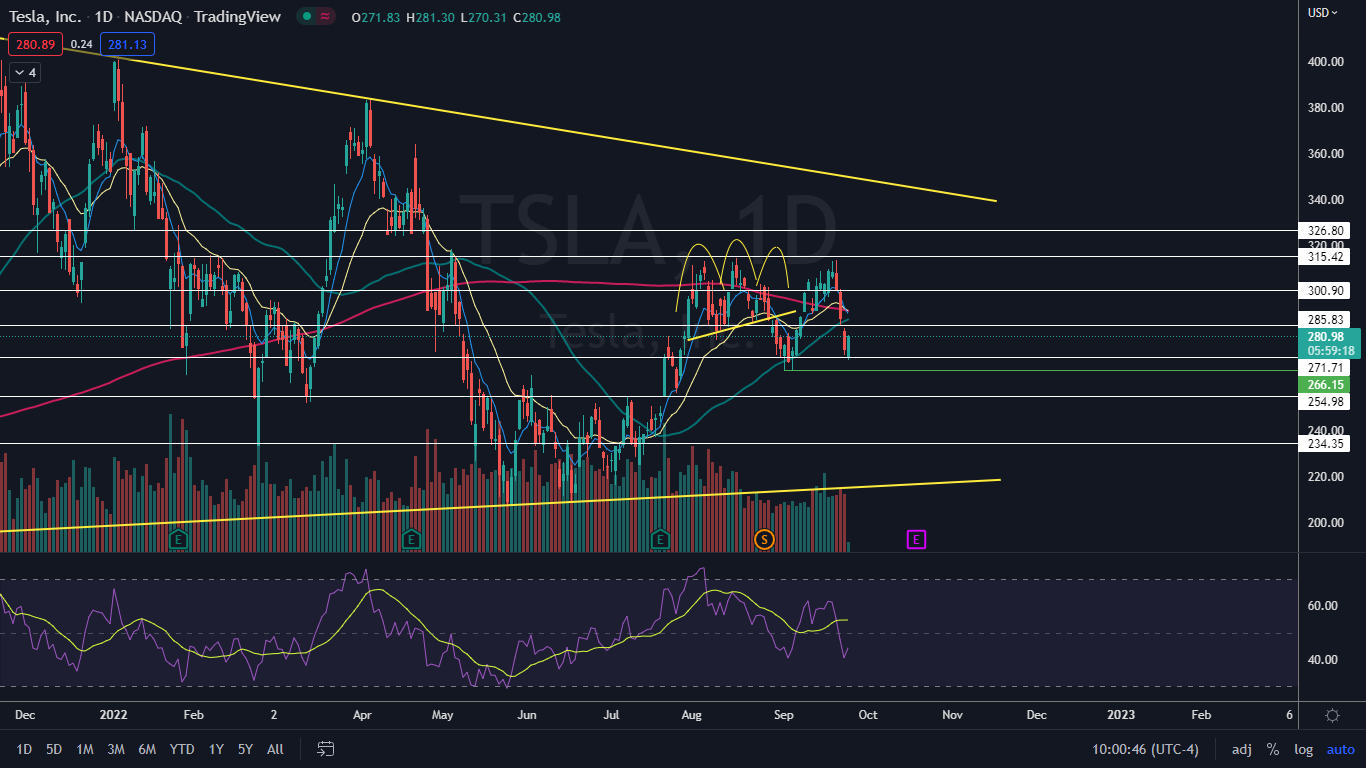
Through the most recent nine-day retracement in the general markets, which saw the S&P 500 decline over 8%, Tesla initially showed comparative strength.
When Tesla attempted to break up above the $315 level on Sept. 20 and Sept. 21, the stock formed a bearish quadruple top pattern, when paired with the price action on Aug. 4 and Aug. 6, which became recognized and set the stock into a downtrend on smaller time frames.
A double top pattern is a reversal indicator that shows a stock has hit a key resistance level, declined, back tested the level as resistance and is likely to retrace again. It is possible the stock may retest the level as support again creating a triple top or even quadruple top pattern.
The formation is always identified after a security has shot up in price and is at the top of an uptrend whereas a bullish double bottom pattern is always found in a downtrend. A spike in volume confirms the double top pattern was recognized and subsequent increasing volume may indicate the stock will reverse into a downtrend.
- Aggressive bearish traders may choose to take a position when the stock’s volume spikes after the second retest of the resistance level. Conservative bearish traders may wait to take a position when the stock confirms a downtrend with the formation of a lower high.
- Bullish traders may choose to wait for the stock to surpass the price at which the stock formed the double top pattern. The level may then become support.
Want direct analysis? Find me in the BZ Pro lounge! Click here for a free trial.
The Tesla Chart: After attempting to regain the $315 level as support multiple times and failing, Tesla gapped down to start the trading day on Thursday and Friday, which created back-to-back bearish kicker candlesticks. On Monday, Tesla gapped down for a third consecutive time and immediately started to bounce, which indicates a pattern named “three-gap down reversal” was recognized.
- Although Tesla negated its most recent uptrend by printing a low under the Sept. 16 higher low of $295.60, the stock hasn’t yet formed a lower high to confirm a downtrend is in the cards. Bearish traders will be watching for Tesla to form a bearish reversal candlestick, such as a doji or shooting star candlestick, under the $313 level to take a possible position.
- Bullish traders may choose to wait and see if Tesla can regain the 200-day simple moving average (SMA) as support, which was lost on Sept. 22. Tesla has been battling the 200-day SMA –an important bellwether indicator, since July 29, indicating indecision about whether the stock is in a bull or bear cycle is currently playing out.
- Tesla has resistance above at $285.83 and $300.90 and support below at $271.71 and $254.98.