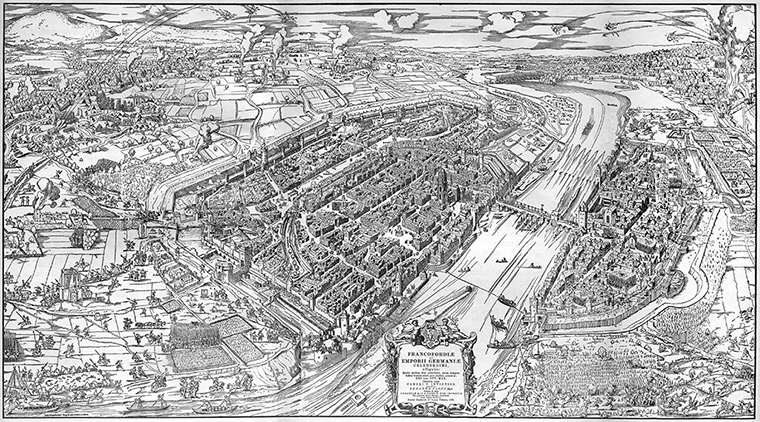
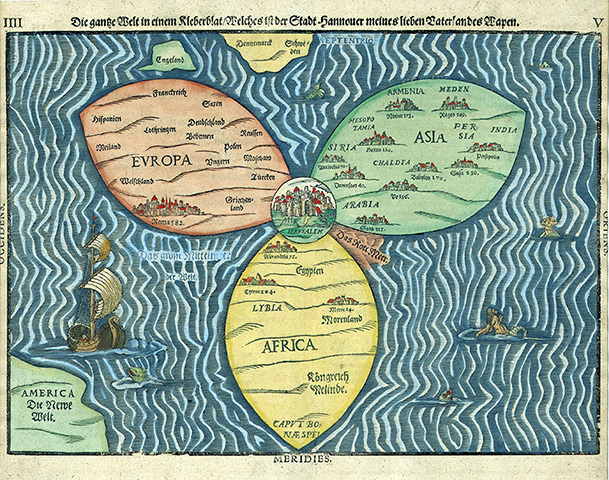
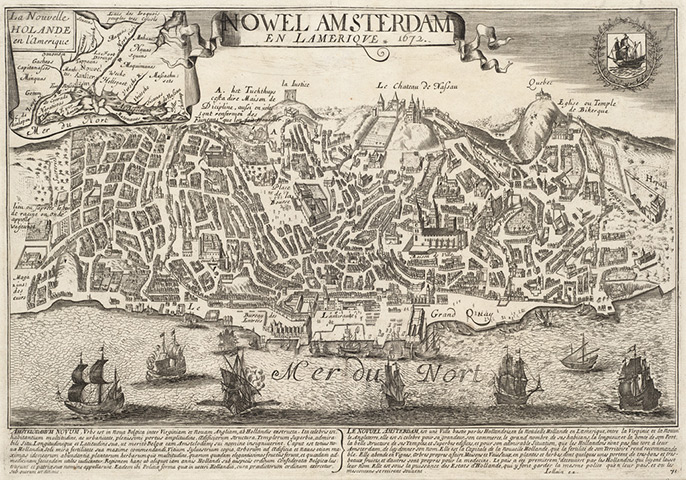
1552: Map of the siege of Frankfurt by Conrad Faber von Kreuznach. This battle during the thirty years war depicts soldiers and battalions to almost blending in with the region’s landscape, on the left Photograph: Public domain1581: Christian medieval map with Jerusalem as the centre of the world, by Heinrich Bunting Image Asset Management Ltd/Alamy1672: New Amsterdam by Gérard Jollain. This map claimed to represent Nowel Amsterdam en Lamerique (New Amsterdam in America). Except that’s not New Amsterdam, it is actually er … Lisbon, Portugal. The fraudulent map does have a few additions, like the castle in the top right that purports to show the French territory Quebec. The British Library
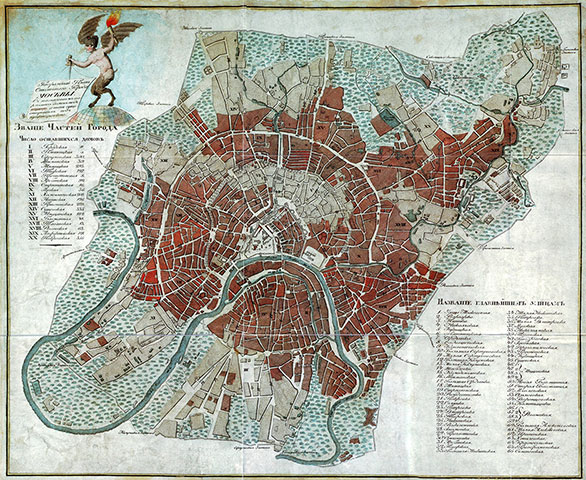
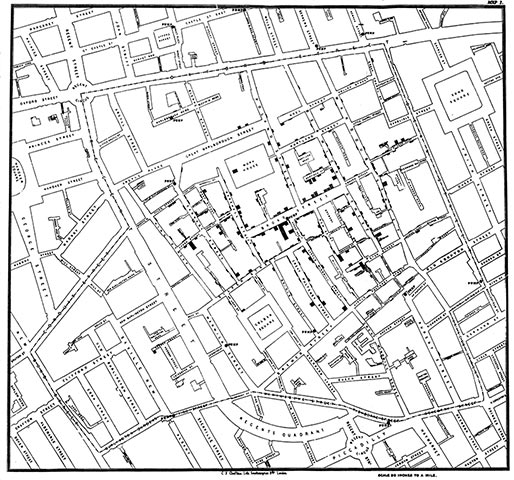
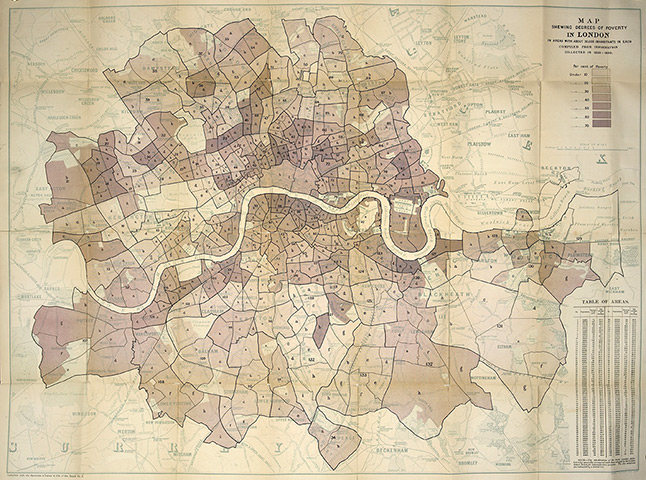
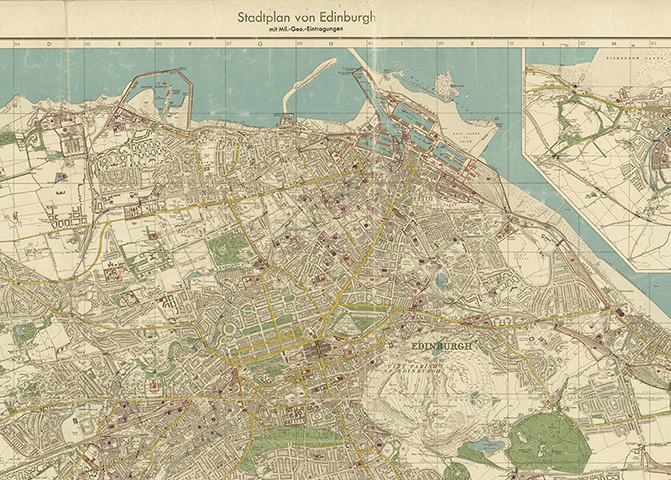
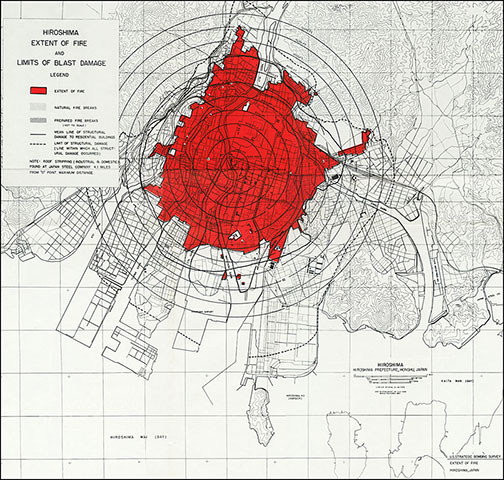
1812: Map of the great fire of Moscow by Russian army topographers. A huge fire devastated the Russian city, destroying an estimated 75% what would later go on to become the capital. The shaded portions of the map depict the areas damaged by the flames, which were thought to have been started by the Russians before Napoleon’s invading troops had a chance to enter the city Photograph: Public domain1854: John Snow's map proving the Broad Sreet pump in Soho was linked to a cholera outbreak in LondonPhotograph: Public domain1869: Paris electoral map by Leon Montigny. We’re all used to maps of elections by now but they’re not exactly a new concept. The rectangles in this map of election results in 1869 featured by Cartographia, show how many voters there are in each district and the colours indicate the way the votes went. Given that the parties of the effective dictator Napoleon III were in yellow, it is clear that the city wasn’t very happy with its leader. Photograph: Public Domain1887: Sanborn insurance maps of San Francisco. Maps were utilised by insurance companies to determine the liability of a particular property via various factors such as its building materials, proximity to other premises and location of nearest fire departmentsPhotograph: Cartography Associates1891: Charles Booth’s poverty map of London. Booth and the survey into life and labour in London (1886-1903) charted boroughs by wealth - the darker the shade, the poorer the area Robana/The British Library via Getty Images1941: German bombing targets in UK cities – this map of Edinburgh provides an insight into the military technology of the second world war Photograph: National Library of Scotland1945: Hiroshima damage map, showing the extent of blast and fire damage to the Japanese city after an atomic bomb was dropped on it by the US Photograph: Public domain
Sign up to read this article
Read news from 100’s of titles, curated specifically for you.