Arctic sea ice has been melting at a slower rate over the last 20 years, despite human-caused global warming, new research has found.
Since satellite records began in the late 1970s, sea ice coverage at the end of summer has halved. Global warming has been shown to be responsible for up to two-thirds of this melting, and the remaining third is down to natural fluctuations in the Earth’s climate systems.
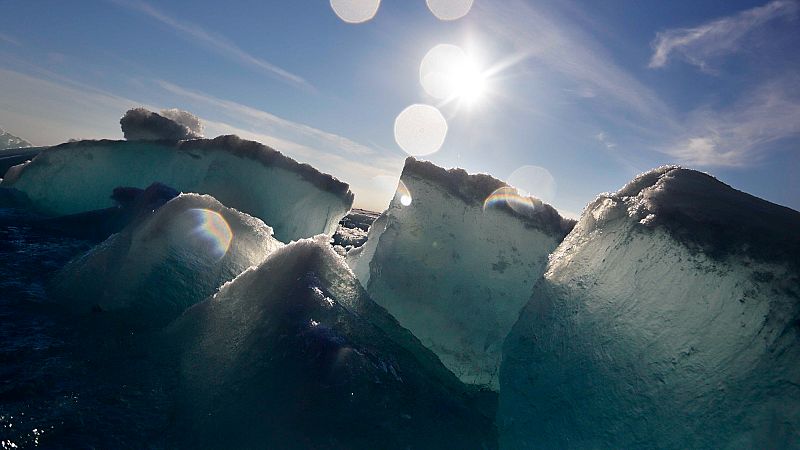
With the Arctic warming at nearly four times the global average, more than 10,000 cubic kilometres of sea ice have been lost since the 1980s - an amount that would fill four billion Olympic swimming pools. In September 2012, Arctic sea ice shrank to its smallest ever extent at just 3.41 million square kilometres, leading to speculation about when the Arctic might see its first ‘ice-free’ summer.
New research shows, however, that the pace of Arctic sea ice loss has slowed markedly since the late 2000s, with no statistically significant decline for the last 20 years.
Scientists say this is a temporary slowdown that may continue for a further five to 10 years. When it ends, it is likely to be followed by faster-than-average sea ice decline.
Dr Mark England, who led the study while at the University of Exeter in the UK, says it may seem “surprising” to find a temporary slowdown in sea ice decline given human-caused climate change.
“It is, however, entirely consistent with climate model simulations and is likely due to natural climate variability superimposed on the human-driven long-term trend,” he explains.
“This is only a ‘temporary reprieve’ and before long the rate of sea ice decline will catch up with the longer term rate of sea ice loss.”
The slowest rate of sea ice loss since records began
The study, published this month in the journal Geophysical Research Letters by researchers from the University of Exeter, looked at Arctic sea ice cover using two different datasets of satellite measurements from 1979 to the present.
Focusing on September, when Arctic sea ice cover is at its lowest during the year, they found that between 2005 and 2024, the ice declined by 0.35 million square kilometres during the first decade and 0.29 million square kilometres during the second.
This makes the rate of loss over the last two decades the slowest for any 20-year period since the start of satellite records in 1979. It was four to five times slower than the peak 20-year period between 1993 and 2012.
Compared to the longer-term rate of decline since 1979, which is 0.78 to 0.79 million square kilometres per decade, that marked a 55 to 63 per cent slowdown.
“It’s a ‘pause’ in the rate of loss of sea ice. Arctic sea ice is still far lower than it was in the 1980s, and the decline has overall slowed down for the study period 2005-2024,” says Dr Gaëlle Veyssière, sea ice and snow physicist at the British Antarctic Survey, who wasn’t involved in the study.
“This pause should not be confused with a sign of recovery. It doesn’t indicate that Arctic sea ice is improving or that we are seeing reversing climate trends.”
Will sea ice loss in the Arctic continue to slow?
The researchers say the slowdown in sea ice melt has a one in two chance of lasting for another five years and a one in four chance of lasting for another 10. But, they clarify, it won’t last forever.
Climate models indicate that when the current slowdown ends, the pace of Arctic sea loss could be 0.6 million square kilometres per decade faster than the average long-term decline.
The study suggests that the current temporary pause is likely due to ‘internal climate variability’ - or the naturally occurring variations in climate due to interactions between parts of Earth’s systems.
Rather than being an expected or rare event, it says we should expect periods like this to occur relatively frequently due to natural fluctuations in the climate system. Without human-caused warming, the study indicates that sea ice likely would have increased over this period.
Dr England invokes an analogy from climate scientist and creator of the iconic warming stripes visualisation, Professor Ed Hawkins. He says the slowdown is like a “ball bouncing down a hill where the hill is climate change”.
“The ball continues going down the hill, but as it meets obstacles in its path, the ball can temporarily fly upwards or sideways and not seem to be travelling down at all, ”England says.
While the trajectory isn’t always smooth, he adds, at some point, the ball will still reach the bottom of the hill.