Strategy (NASDAQ: MSTR) stock closed at $300.70 after sliding nearly 7% on Thursday, leaving the stock at one of the most critical points in its trading history.
Daily Chart Signals Breakdown Risk Below $300
The drop follows a multi-week downtrend as an anticipated recovery failed to take shape, pushing the price against a dense support cluster.
This zone has become both a technical floor and a psychological barrier, and its defense or failure could shape the stock's direction for the rest of the year.
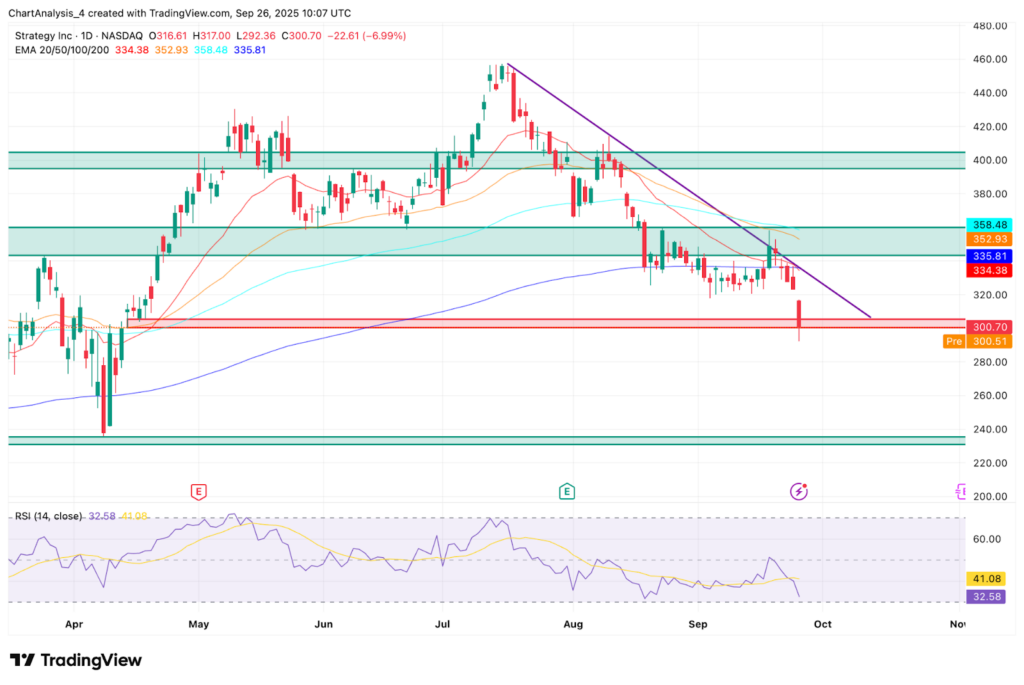
MSTR Key Technical Levels (Source: TradingView)
Technical analysis: On the daily timeframe, Strategy has fallen beneath the 20, 50, and 100-day EMAs, turning the 200-day EMA near $335 into overhead resistance.
The Relative Strength Index is holding near 32, signaling the stock is approaching oversold territory without yet confirming a reversal.
Market structure highlights the risks: a breakdown below $295–$300 could send the stock toward $260, with deeper losses potentially testing $225.
Short-term traders remain cautious as momentum points lower unless a sharp recovery materializes.
Market Divided Between Breakdown Calls And Swing Traders
Analyst Peter DiCarlo noted that Strategy is pressing directly into the "smart money zone" after failing to generate the expected bounce earlier in September.
He highlighted that price is now sitting at the THT point of control, and warned that if this level fails, the stock could face serious trouble in the coming months.
The volume profile reinforces this view, showing that liquidity thins quickly below the $295–$300 shelf.
If it breaks, the stock risks an accelerated drop toward $260 or lower.
The RSI at 31 also signals deeply oversold conditions, a setup that often precedes short-term reflex rallies. For some traders, this raises hopes for a rebound back to $335–$350.
Others, however, argue that repeated failed bounces reflect weakening conviction, suggesting that even institutions may not step in with the same force as before. That split has turned the $300 band into a battleground between breakdown calls and those betting on another swing higher.
Regulatory Scrutiny Threatens To Amplify Stock Volatility
Beyond the charts, regulatory concerns have resurfaced.
As per Reuters, U.S. regulators are examining sharp stock moves that occurred ahead of corporate announcements about crypto-treasury strategies.
The SEC and FINRA have contacted several firms over possible insider trading and disclosure issues.
While Strategy has not been named directly, its position as the most visible corporate adopter of Bitcoin puts it squarely in the spotlight.
Any negative findings could weigh disproportionately on sentiment and fuel further volatility.
Read Next:
Image: Shutterstock