
- The Vanguard Total Stock Market ETF (VTI) is only 2.65% below its all-time high, despite widespread market panic.
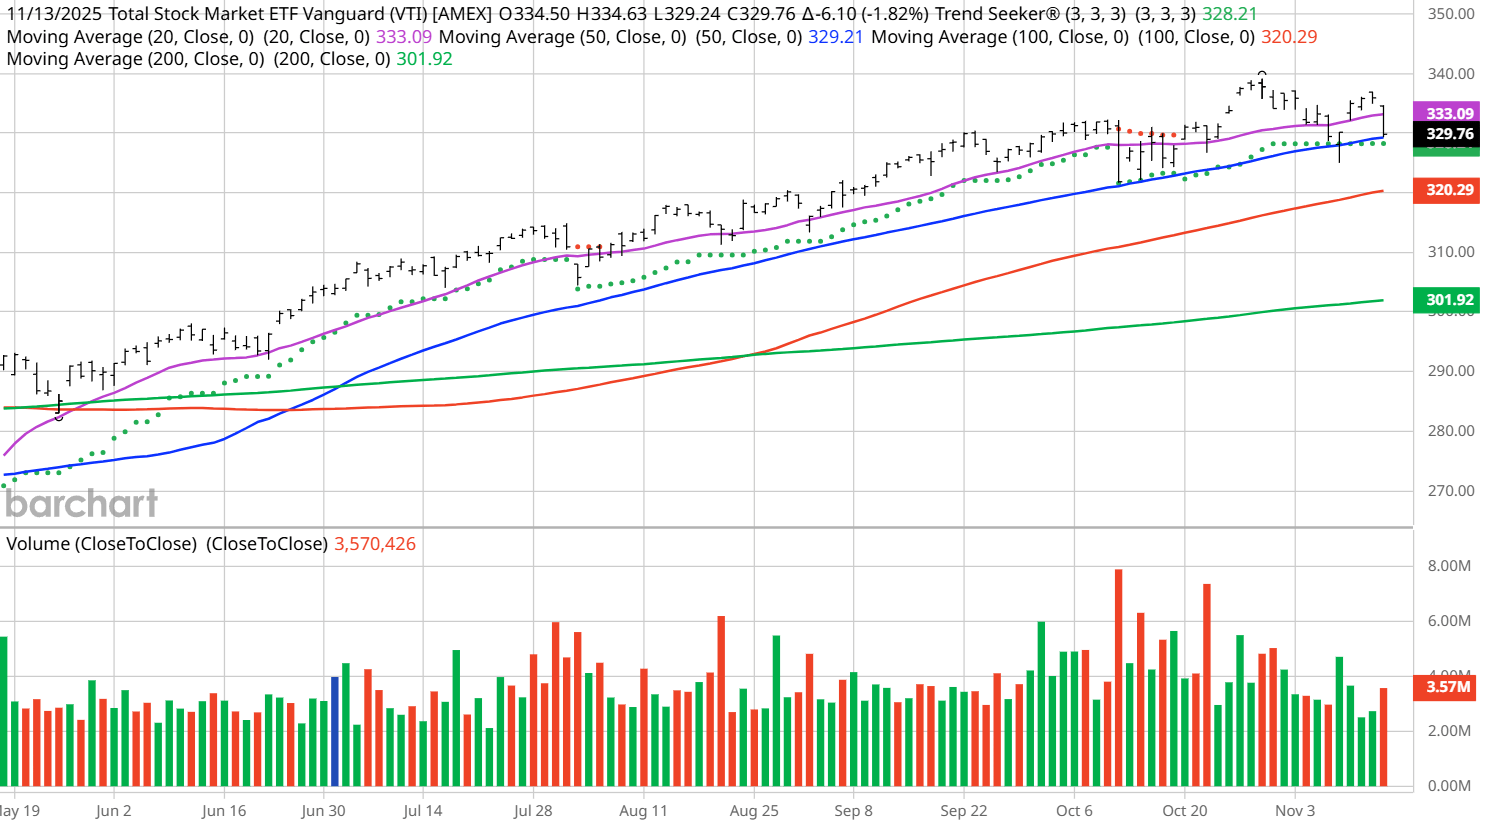
- Key technical indicators, including various moving averages and trend signals, show no immediate cause for concern for VTI.
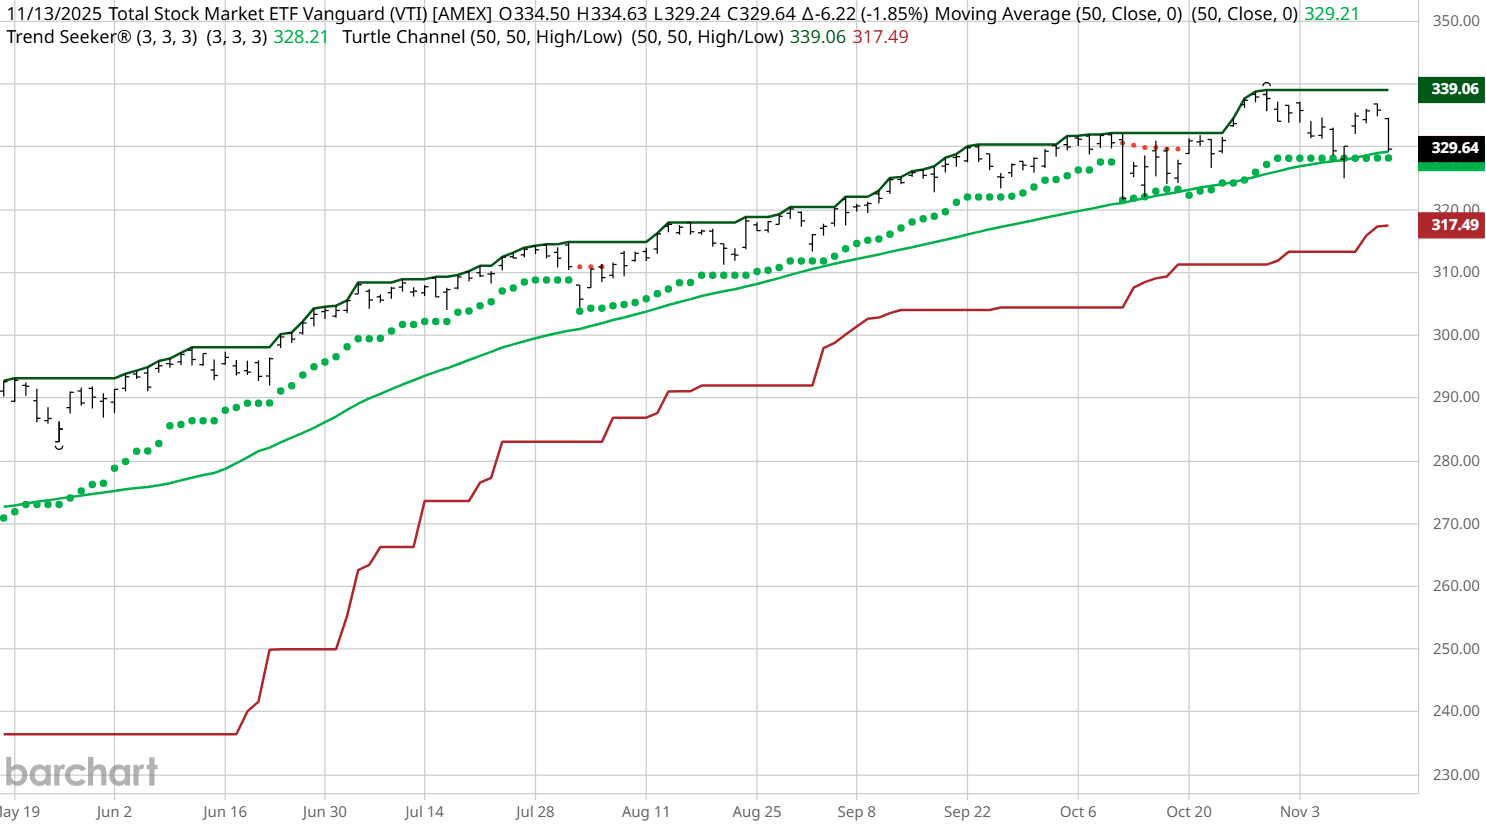
- Short-term trading charts also suggest stability, with price action remaining within established channels and above critical support levels.
- Rather than reacting to media-driven fear, I recommend maintaining composure and sticking to disciplined stop-loss strategies.
Today I’m not going to make any suggestions. I’m just going to show you two charts and let you make up your own mind.
For some reason, financial pundits are in a panic and throwing out lots of bad advice.
The “market,” as represented by the Vanguard Stock Total Market ETF (VTI), closed Thursday only 2.65% off its all-time high.
I present just two charts for you:
My normal Chart of the Day showing price, Trend Seeker, 20-, 50-, 100- and 200-day moving averages:
And my short-term trading chart showing the price, Trend Seeker, 50-day moving average, and the 50-day Hi/Lo turtle channel:
Unlike the talking heads on the TV, I see no reason to panic. My stop losses are set, my scotch is poured, and I spent Thursday evening sitting on the porch enjoying the sunset. How about you?