As we move deeper into August, historical trends, technical indicators, and market valuations are all starting to flash red. The S&P 500 Index ($SPX) has been on a tear — up over 24% in the past four months — but smart investors know that momentum alone isn’t a reason to get comfortable.
In fact, if history is any guide, now is precisely the time to tighten up risk management.
Seasonality: The August-September Trap
Let’s start with what’s staring us in the face: seasonality. When analyzing S&P 500 performance in post-election years going back 75 years, we see a strong and consistent pattern. The index typically peaks in early August, with weakness continuing through September and bottoming near early October.
This isn’t isolated. Cboe Volatility Index ($VIX) seasonality shows a similar pattern — bottoming in late July and ramping up throughout August and September.
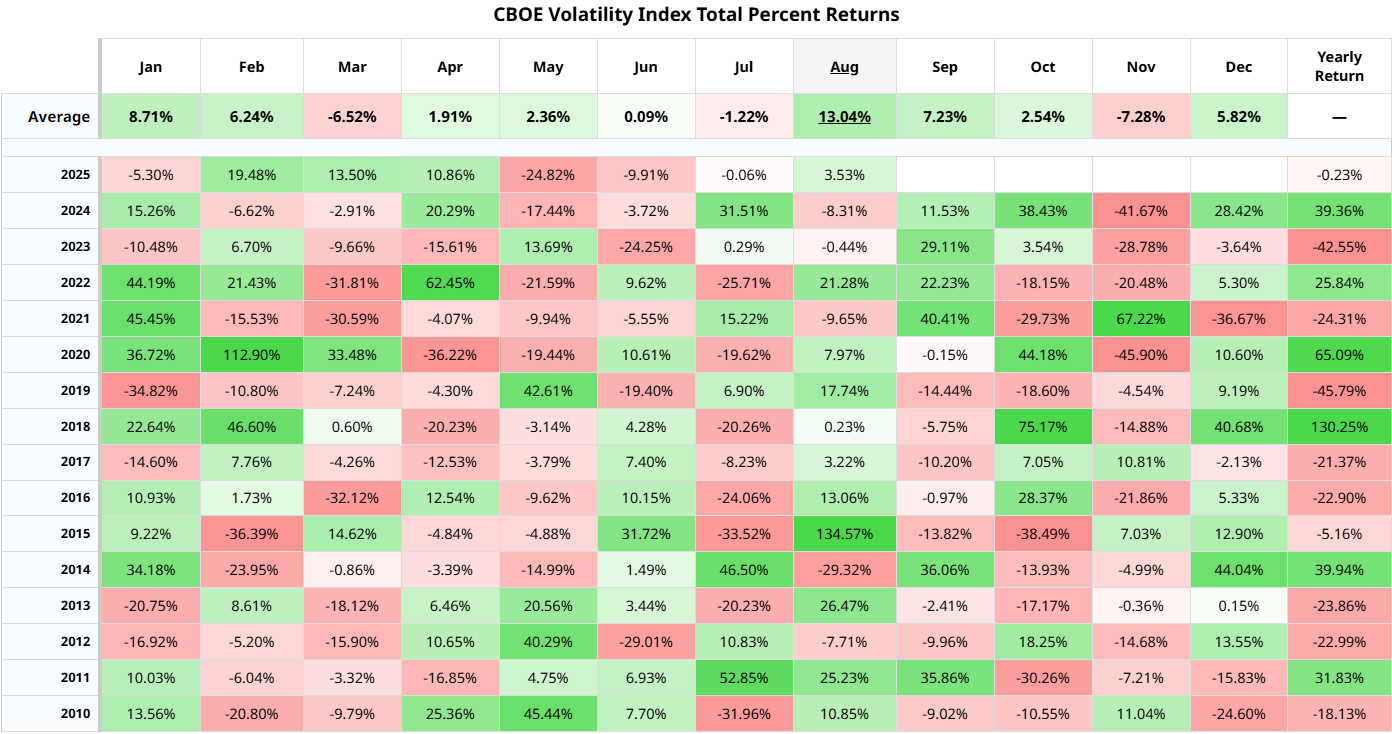
On average, August and September are two of the weakest-performing months for U.S. equities. While the start of August can appear deceptively strong, that strength tends to fade fast — and in post-election years, like the one we’re in now, that pattern is even more pronounced.
Valuation Risk: Echoes of the Dot-Com Bubble
The warning signs aren’t just seasonal; they’re structural. Based on the Shiller PE ratio and the Buffett Indicator, the S&P 500 is now more expensive than nearly any time in modern history — second only to the 2000 dot-com Bubble.
Even traditionally defensive sectors like consumer staples are showing stretched valuations. And tech mega-caps, the heavyweights of this rally, are trading at earnings multiples that defy economic gravity.
Margin debt has also surged, a classic late-cycle signal. Deutsche Bank notes we’re seeing the fifth-fastest increase since 1998, a red flag eerily similar to 1999 and 2007.
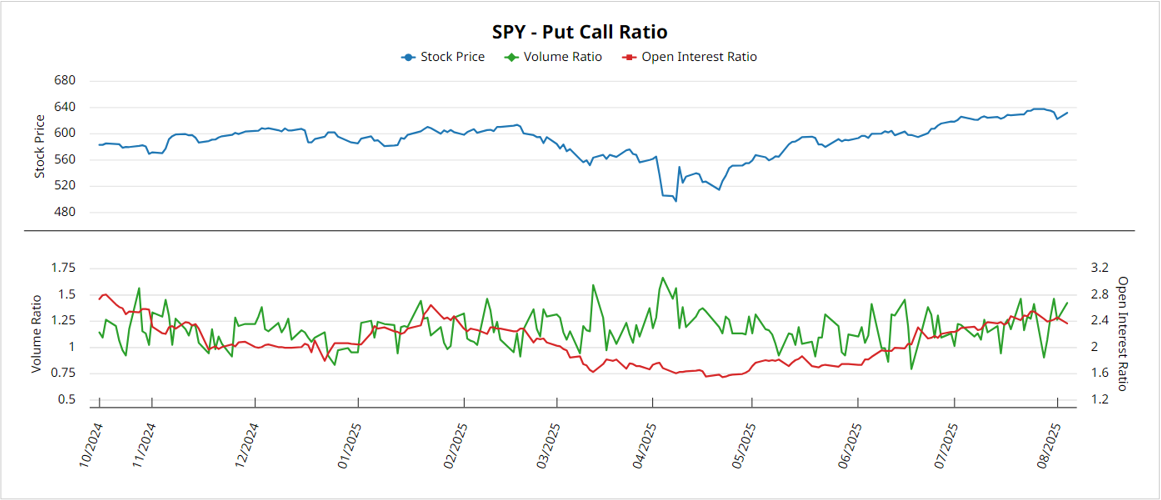
Sentiment Signals: Rising Put/Call Ratios and “Euphoria” Indicators
The market may still be climbing, but under the surface, defensive positioning is increasing. The put/call ratio is on the rise, indicating that more traders are betting on downside moves. This isn’t typical during a bull run — unless smart money is quietly hedging.
Separately, Citi’s Levkovich Index and Barclays’ Equity Euphoria Indicator are also both flashing elevated levels — both of which have historically preceded pullbacks or sharp corrections.
For the full breakdown on the indicators we’re watching this August, watch the reel:
Action Plan: What You Can Do Right Now
It’s not time to panic — it’s time to prepare. Here’s how to start.
Use these tools on Barchart to stay ahead of the curve:
- Put/Call Ratio – Gauge market sentiment and hedging activity.
- RSI & MACD Indicators – Spot overbought/oversold conditions.
- Seasonality Charts – Understand historical patterns in August/September.
- Valuation Multiples – See how today’s prices stack up historically.
Combine technical signals with historical probabilities to craft your risk management plan now — before volatility strikes. And be sure to follow @barchartofficial on Instagram to stay informed with more market insights throughout the session.
On the date of publication, Barchart Insights did not have (either directly or indirectly) positions in any of the securities mentioned in this article. All information and data in this article is solely for informational purposes. For more information please view the Barchart Disclosure Policy here.