
State Street (STT) stock is in focus on Monday following the investment bank's first-quarter results and amid sharp financial-sector volatility.
Bank and financial stocks began reporting earnings on Friday, led by JPMorgan (JPM). A few financial-sector reports followed on Monday, including State Street, M&T Bank (MTB) and Charles Schwab (SCHW).
Don't Miss: How Far Can JPMorgan Stock Rally on Earnings?
While larger investment banks will report this week, we’re already seeing outsized moves in some of these stocks.
At today’s low, State Street stock was down 18%, hitting its lowest level since October. At last glance, the shares were down 11%.
The volatility comes as State Street reported its top and bottom lines came up short vs. analysts’ expectations.
With the shares slumping hard off the lows, investors want to know if State Street stock is worth buying. Let's check the chart.
Trading State Street Stock on Earnings
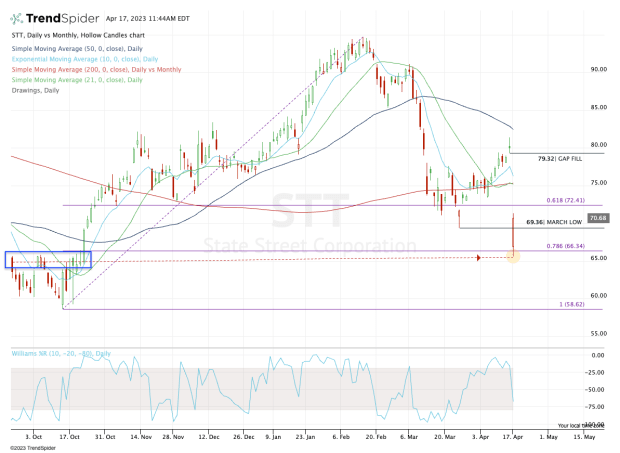
Chart courtesy of TrendSpider.com
First and foremost, State Street stock has been highly volatile. The message for traders is clear: Avoid this name if it doesn’t suit your strategy or, at the very least, consider reducing your position sizes to account for this increased volatility.
The chart above highlights why a multi-time-frame-analysis approach can benefit traders.
While the 78.6% retracement clearly was a level of interest near $66, it became much more significant when we overlay the 200-week moving average on the chart. The 200-week comes into play near this area, too.
Lastly, the $65 to $66 zone was resistance in October before a breakout kickstarted a much larger rally.
Combine these factors and we get a clear picture on why the stock may hold for a bounce.
Don't Miss: Is AMD Stock About to Bounce? Here's the Setup.
With the bounce under way, State Street stock has reclaimed last month’s low of $69.36 and is looking to push higher. If it can continue to rally, $75 will be a key area on the upside.
That’s where the stock runs into its 200-day and 21-day moving averages. Above that and the gap-fill level at $79.32 is in play.
On the downside, the bulls don’t want to see State Street stock fall back below the March low of $69.32. If it does, the $66 area is vulnerable to another retest.