Now, a word about the state of starting pitching: abysmal.
Injuries, six-man rotations and the curtailing of workloads are continuing a decade-long trend of sapping the glamour out of the role, not to mention the effectiveness.
As former GM and pitcher Ed Lynch likes to say, pitcher is the only position in sports for which we build a literal pedestal. For many years the biggest draw to sell tickets was simply the starting pitching matchup. Now, starting pitching is increasingly a losing proposition. A starting pitcher’s main job in today’s game is to navigate twice through the lineup and not blow up the game, or as starting pitchers love to say, “Give my team a chance to win.” The bar keeps getting lower.
Here is the state of starting pitching:
- Starting pitchers this year have posted the fourth-worst winning percentage since 1901 (.476). With a 4.45 ERA, only twice before in the past 123 years have starters had such a high ERA and such a low win percentage (2019 and ’20).
- Starters account for only 59% of wins, down from 70% in 2014. Fewer innings mean fewer wins.
- From 2014 to this year, the percentage of quality starts (at least six innings with no more than three earned runs) has dropped from 54% to 35%.
- The average starting pitcher faces 22.2 batters. Twenty years ago, it was 25.4. Thirty years ago, it was 26.2.
- In the first 1,406 starts this year (29% of the season), no pitcher threw more than 115 pitches in a game. In 2016 there were 26 starts through the same date with more than 115 pitches.
- From 2015 to ’22, starts lasting at least seven innings were cut in half. The percentage of such starts is down again this year:
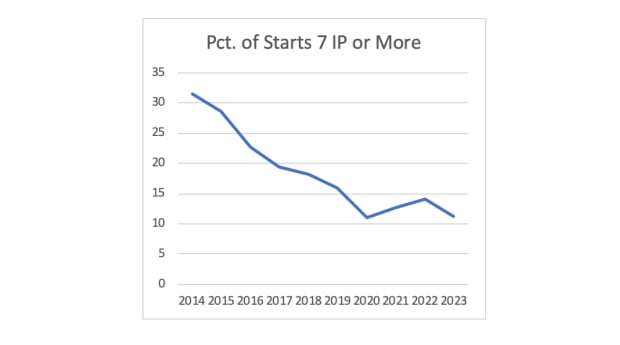
- Teams have used 232 starters already this season—more than any full season from 1901 through ’74. From 2014 to ’21, qualified pitchers (at least one inning for every team game, or 162 innings for a full season) fell 56% to an all-time low of 39.
- In just the past decade, clubs have made a significant reduction in how often they use starters. Only 29.7% of starts are made with four days of rest. Ten years ago, it was 49.4%. Get used to it: Five days is normal rest, not four. Teams prefer to scramble to find a sixth starter (most have trouble finding a fifth) rather than pitch someone on the fifth day. Teams with the fewest starts on four days’ rest are the Brewers (10), Angels (11), Mets and Padres (13), and Guardians and Mariners (15).
- As workload drops, injuries mount. Teams have placed 98 starting pitchers on the IL this year at a sunk cost of $110 million (and on pace for a record $381 million), according to Spotrac data. That’s more starting pitchers already on the IL this year than over the entire 2016 season (95).
- The odds of a starting pitcher going on the IL are nearly the same as a flip of the coin:
Starting Pitchers
| Year | IL | ALL | Pct. |
|---|---|---|---|
2023 |
98 |
232 |
42.2% |
2022 |
167 |
367 |
45.5% |
2021 |
175 |
396 |
44.2% |
2020 |
88 |
294 |
30% |
2019 |
115 |
368 |
31.3% |
2018 |
117 |
343 |
34.1% |
2017 |
106 |
315 |
33.7% |
2016 |
95 |
310 |
30.6% |
2015 |
72 |
313 |
23.0% |
- The Dodgers, Rockies, Royals and Tigers all have five starting pitchers on the IL. Among the top starters on the IL are Jacob deGrom, Julio Urías, Carlos Rodón, Max Fried, Brandon Woodruff, Robbie Ray, Walker Buehler and Hyun Jin Ryu.
Baseball is very different from what it was in, say, the 1970s and ’80s. There is more size, power, training, technology, knowledge and inventory with pitching to sensibly move away from the days of starters throwing complete games and 250 innings a year. The point here is that baseball has moved so fast in just the past 10 seasons as to redefine starting pitching. We’re talking just within the career of someone like deGrom. Here is what massive change looks like:
Starting Pitching Comparison
| Year | Win Pct. | ERA | Pct of Ws | QS | 7+IP Starts | Pitches/GS |
|---|---|---|---|---|---|---|
2014 |
.498 |
3.82 |
70.2% |
54% |
31.4% |
96 |
2023 |
.476 |
4.45 |
59.0% |
35% |
11.2% |
87 |
The change has happened fast. Starting pitchers pitch less often, throw fewer pitches when they do, make fewer quality starts and win less often—by a lot.
Why is that? It’s a host of factors. Once science equated fatigue with injury risk, teams went overboard with governors on their pitchers, especially in how they train pitchers before they get to the majors. Urías, for instance, has thrown only four 100-pitch games in his first 111 starts—and never more than 101. At the same juncture, Gerrit Cole had thrown 100 pitches 54 times. Urías has never recorded an out after the seventh inning, yet will strike it rich as a free agent this winter.
The dialing back on workload was accelerated by the pandemic year and made possible by the growing inventory of hard throwers—not necessarily pitchers—who work just fine in short exposure out of the bullpen.
The further defining of risk-reward by analytics also accelerated the decline of starting pitchers. The “third time around” effect is real; a fresh reliever is almost always better than a starter facing the same hitters a third time in a game. And risk-reward as it relates to game leverage also plays a role.
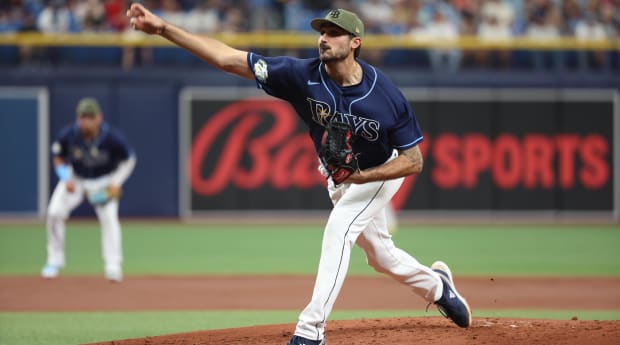
Kim Klement/USA TODAY Sports
On Saturday, for instance, Zach Eflin of the Rays was so sharp against Milwaukee that he threw only 21 balls to 24 batters and needed just 85 pitches to cover seven innings. But when Tampa Bay boosted its lead from 6–3 to 8–3 with two runs in the bottom of the seventh, Rays manager Kevin Cash saw no need to have one of his best starters keep pitching with a five-run lead and six outs to go. Those are low-leverage outs. Cash has not permitted any of his starters this year to throw more than 102 pitches.
Moreover, with less length expected from them, starting pitchers have adopted the approach of relievers: Max out on velocity and chase swing and miss right from the start, even if it means walking hitters with spin when behind in the count. (Walks and strikeouts are both up this year—by 3.8% combined.)
Here is a good visual of what pitching is today:
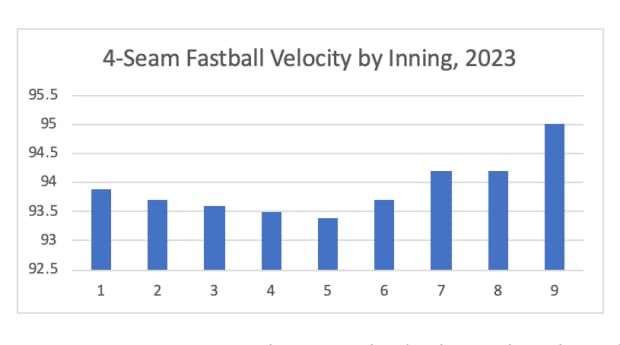
A starter comes out throwing as hard as he can, his velocity drops with each inning, then when relievers take over in the sixth inning velocity cranks back up and hits its highest levels.
There is a tendency this year to rush to blame the new rules, especially the pitch timer, for any trend. “Pitch timer” is to baseball what “supply chain” has been to economics. Let’s wait for more than 29% of the season to make firm conclusions. And remember, across more than 7,000 minor league games where the pitch timer was tested, injuries went down.
What is true anecdotally is players are still adjusting to the pitch timer. Long innings are more wearisome without the physical and mental breaks of walking off the back of the mound and slowing down the game. Hitters get a timeout each plate appearance; pitchers do not (though many have figured out the way to buy more time is to request a new baseball, which must be honored by the umpire and resets the timer).
Pitchers who don’t use the PitchCom device to call their own pitches have little time to shake through signs. Cardinals manager Oliver Marmol says part of his pitchers’ early-season troubles, especially with two strikes, was related to the condensed time in what for them was a new world of sign-shaking. Nobody, he says, shook Yadi Molina.
But something much bigger is going on here than the pitch timer. It has been a decade-long decline in the value of starting pitching. The trend shows no signs of slowing.