Starbucks Corporation (SBUX) reportedly exceeded analysts' expectations for its fiscal fourth quarter, riding the wave of strong U.S. demand for its premium beverages.
However, noticeable decreases in the company's market value in recent months imply a potential slowdown in sales due to tightened consumer spending, increasing labor unrest, and boycotts fueled by the Israel-Gaza conflict.
In light of these factors, J.P. Morgan analyst John Ivankoe has trimmed his sales estimates for the company for the fiscal first quarter, pointing towards an evident slowdown during the holiday season as opposed to the Fall promotions.
Looking forward to fiscal 2024, Starbucks has lowered its forecast for same-store sales growth from a long-term projection of 7-9% to the range of 5-7%. On the other hand, the company's predicted revenue growth of 10-12% aligns with its previous guidance. However, CFO Rachel Ruggeri suggests net sales are likely to land on the lower end of the given range. Starbucks forecast an earnings per share growth of 15-20%.
Street analysts predict Starbucks' revenue and EPS will surge by 10.5% and 25.1%, respectively, reaching $9.63 billion and $0.94 fiscal quarter ended December 2023.
Despite bullish expectations, there may be continuous downward pressure on SBUX due to the boycotts, labor disputes, and geopolitical tensions. Thus, potential investors may find it prudent to await an opportune entry point into purchasing Starbucks stock. A comprehensive examination of Starbucks' fundamental performance indicators could provide valuable insights moving forward.
Starbucks Corporation's Financial Performance and Analyst Predictions from March 2021 to October 2023
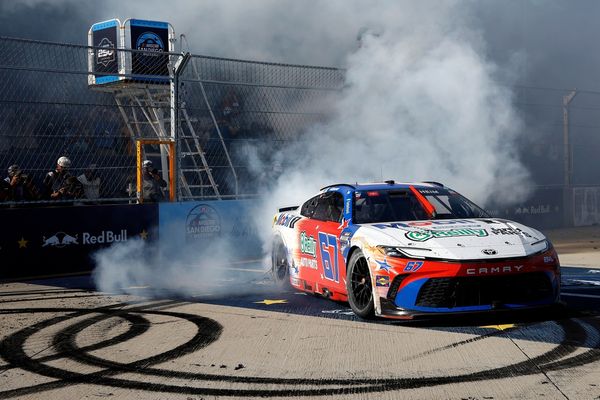
The trailing-12-month Net Income of SBUX has undertaken notable fluctuations as observed from the data provided. The significant highlights are as follows:
- The earliest data, dating back to December 27, 2020, shows a net income of $664.8 million.
- Over the year 2021, there was a substantial increase in the Net Income, which rose from $995.8 million on March 28, 2021, skyrocketed to $2.83 billion on June 27, 2021, and then again to $4.20 billion by October 3, 2021.
- The Net Income demonstrated an upsurge in the first quarter of 2022, reaching approximately $4.41 billion on April 3, 2022.
- However, the third quarter of 2022, saw a mild decrease, with net income falling to $4.17 billion on July 3, 2022, before plummeting to $3.28 billion on October 2, 2022.
- The year 2023 witnessed a relatively steady recovery after the drop in the previous year. The Net Income increased from $3.32 billion on January 1, 2023, to $3.78 billion on July 2, 2023, and touching $4.12 billion on October 1, 2023.
In terms of growth rate, there has been a substantial escalation from the initial value of $664.8 million on December 27, 2020, to the last recorded value of $4.12 billion on October 1, 2023, showing a noticeable progression in Starbucks Corporation’s Net Income over the time duration. It is crucial to note that these trends and fluctuations might be influenced by various factors – seasonal changes, major business decisions, market trends, etc.
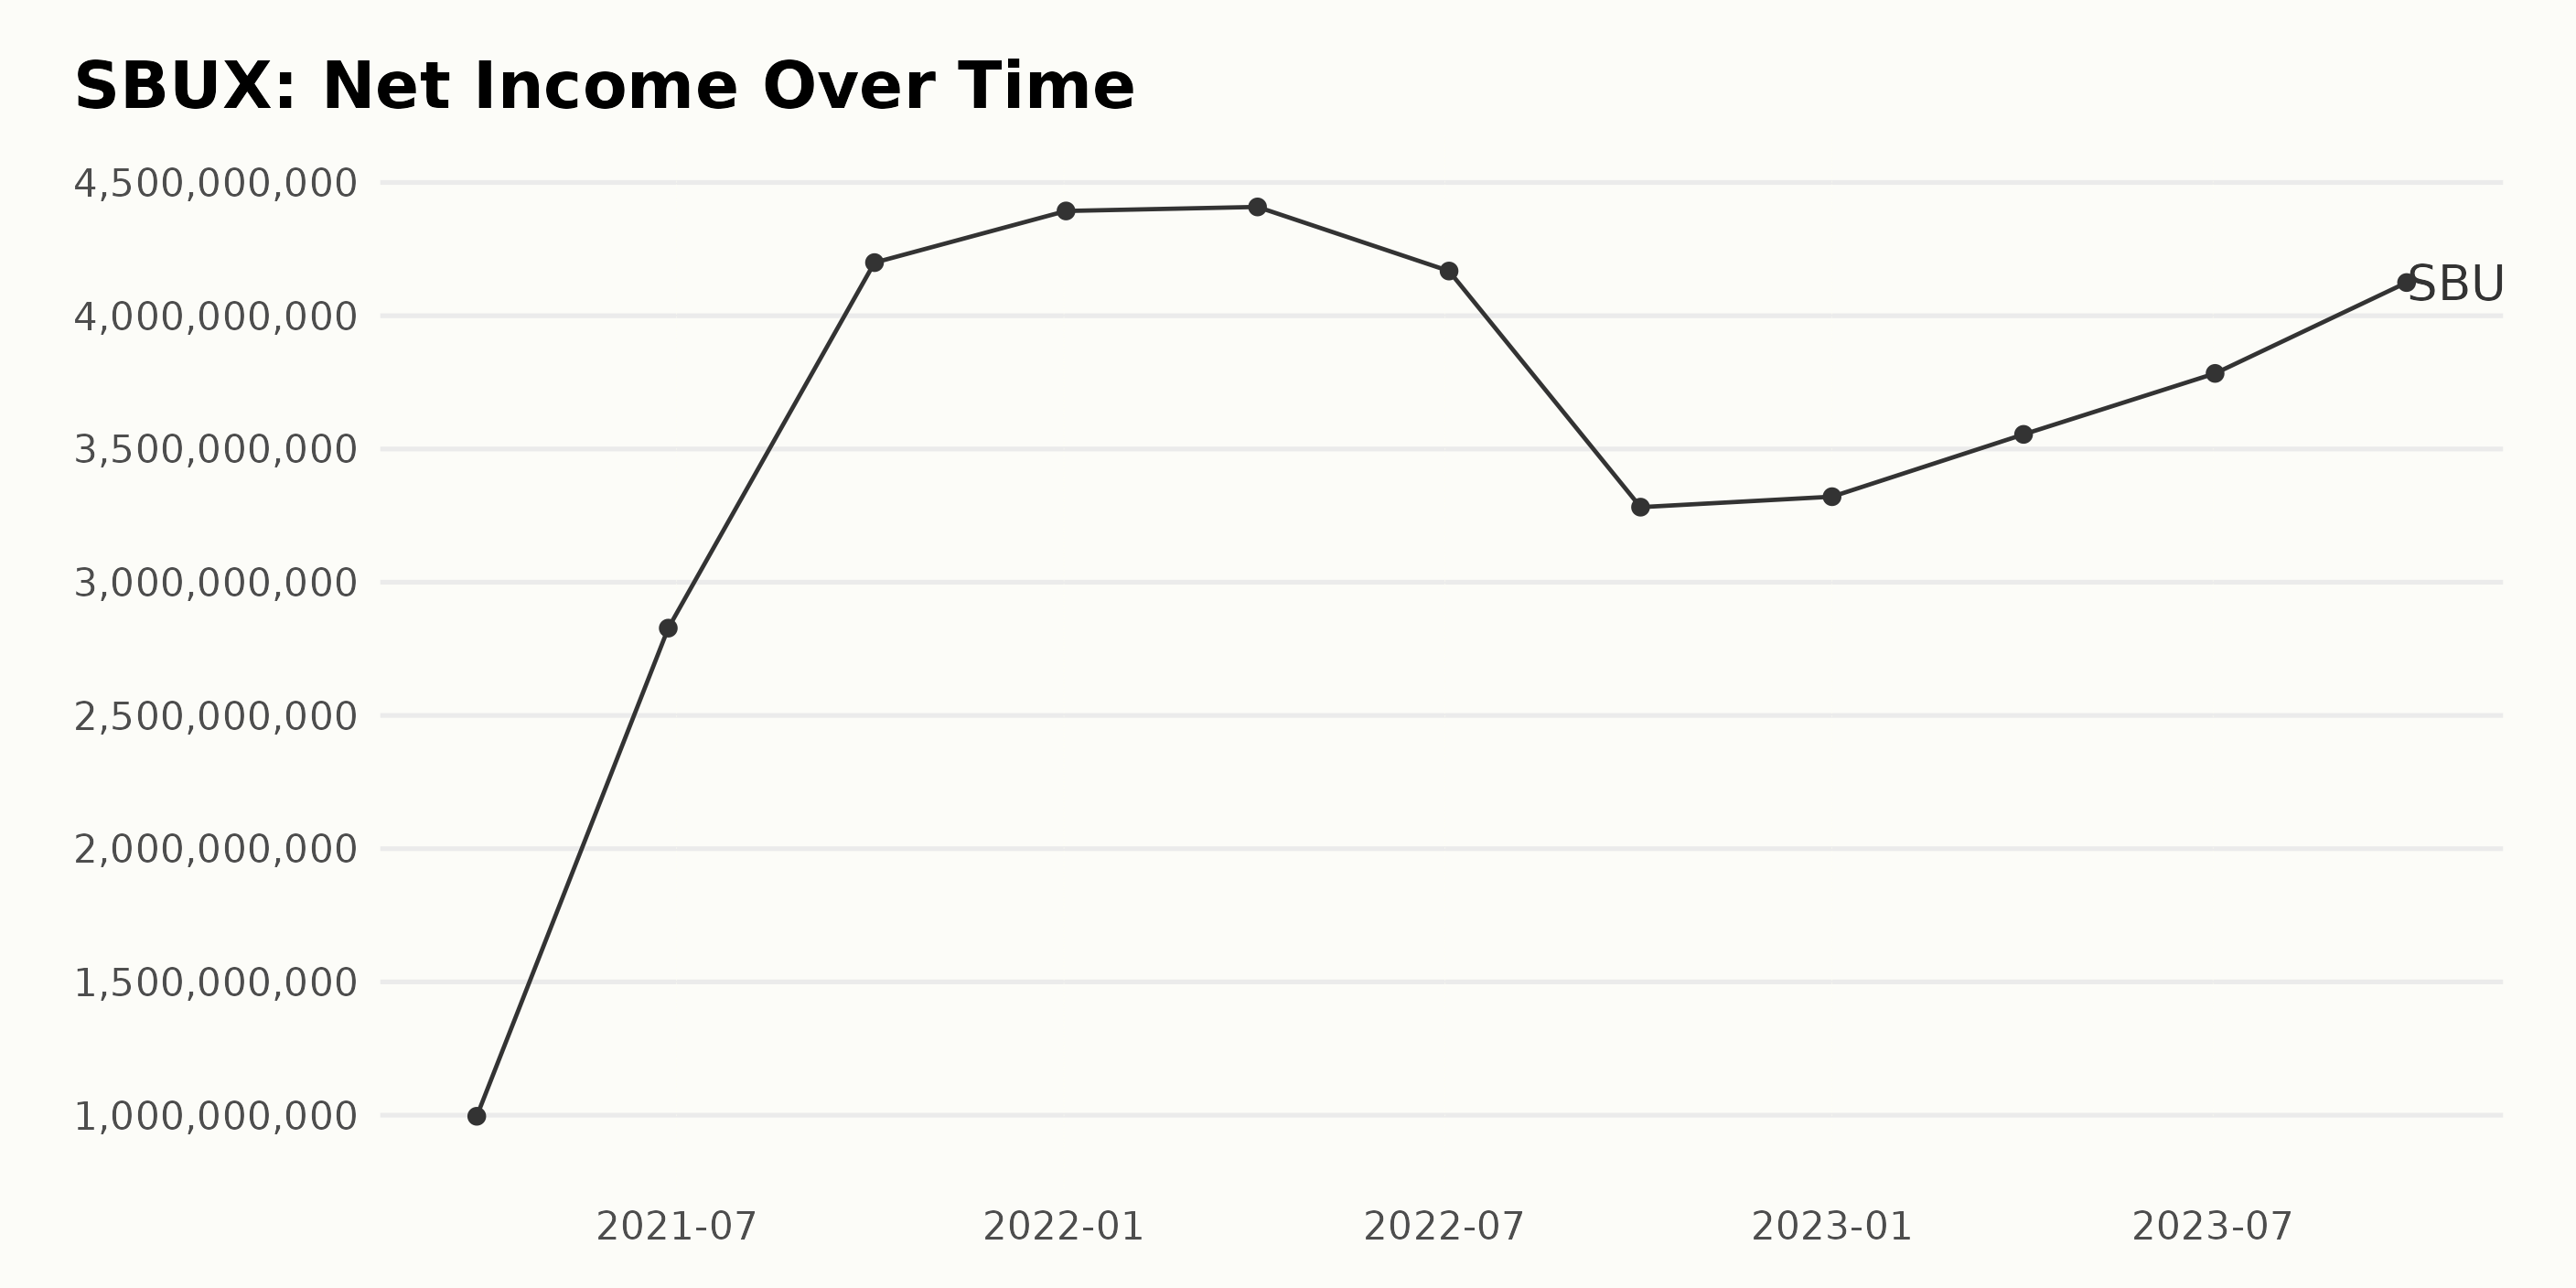
The Starbucks Corporation (SBUX)’s trailing-12-month Revenue has generally been on an upward trend from December 2020 to October 2023, with some fluctuations. The data shows steady growth. Here are the highlights of the Starbucks Corporation’s revenue growth:
- In December 2020, the Revenue was at $23.17 billion.
- There was a steady rise in Revenue over the following quarters, reaching $29.06 billion in October 2021 and $32.25 billion in October 2022.
- The most rapid growth appears to have occurred between June and September 2021, where the Revenue jumped from $27.12 billion to $29.06 billion, signifying a remarkable surge within this period.
- However, the period between July and October 2022 saw a somewhat slowed growth, where the Revenue only increased from $31.93 billion to $32.25 billion.
- Towards the end of the series, from January 2023 to October 2023, the Revenue demonstrated robust growth, from $32.91 billion to $35.98 billion, indicating a strong financial period for the corporation.
The last reported value in the series is $35.98 billion as of October 2023. Comparatively, from the initial reported revenue of $23.17 billion in December 2020, this signifies a growth rate of approximately 55% over almost three years.
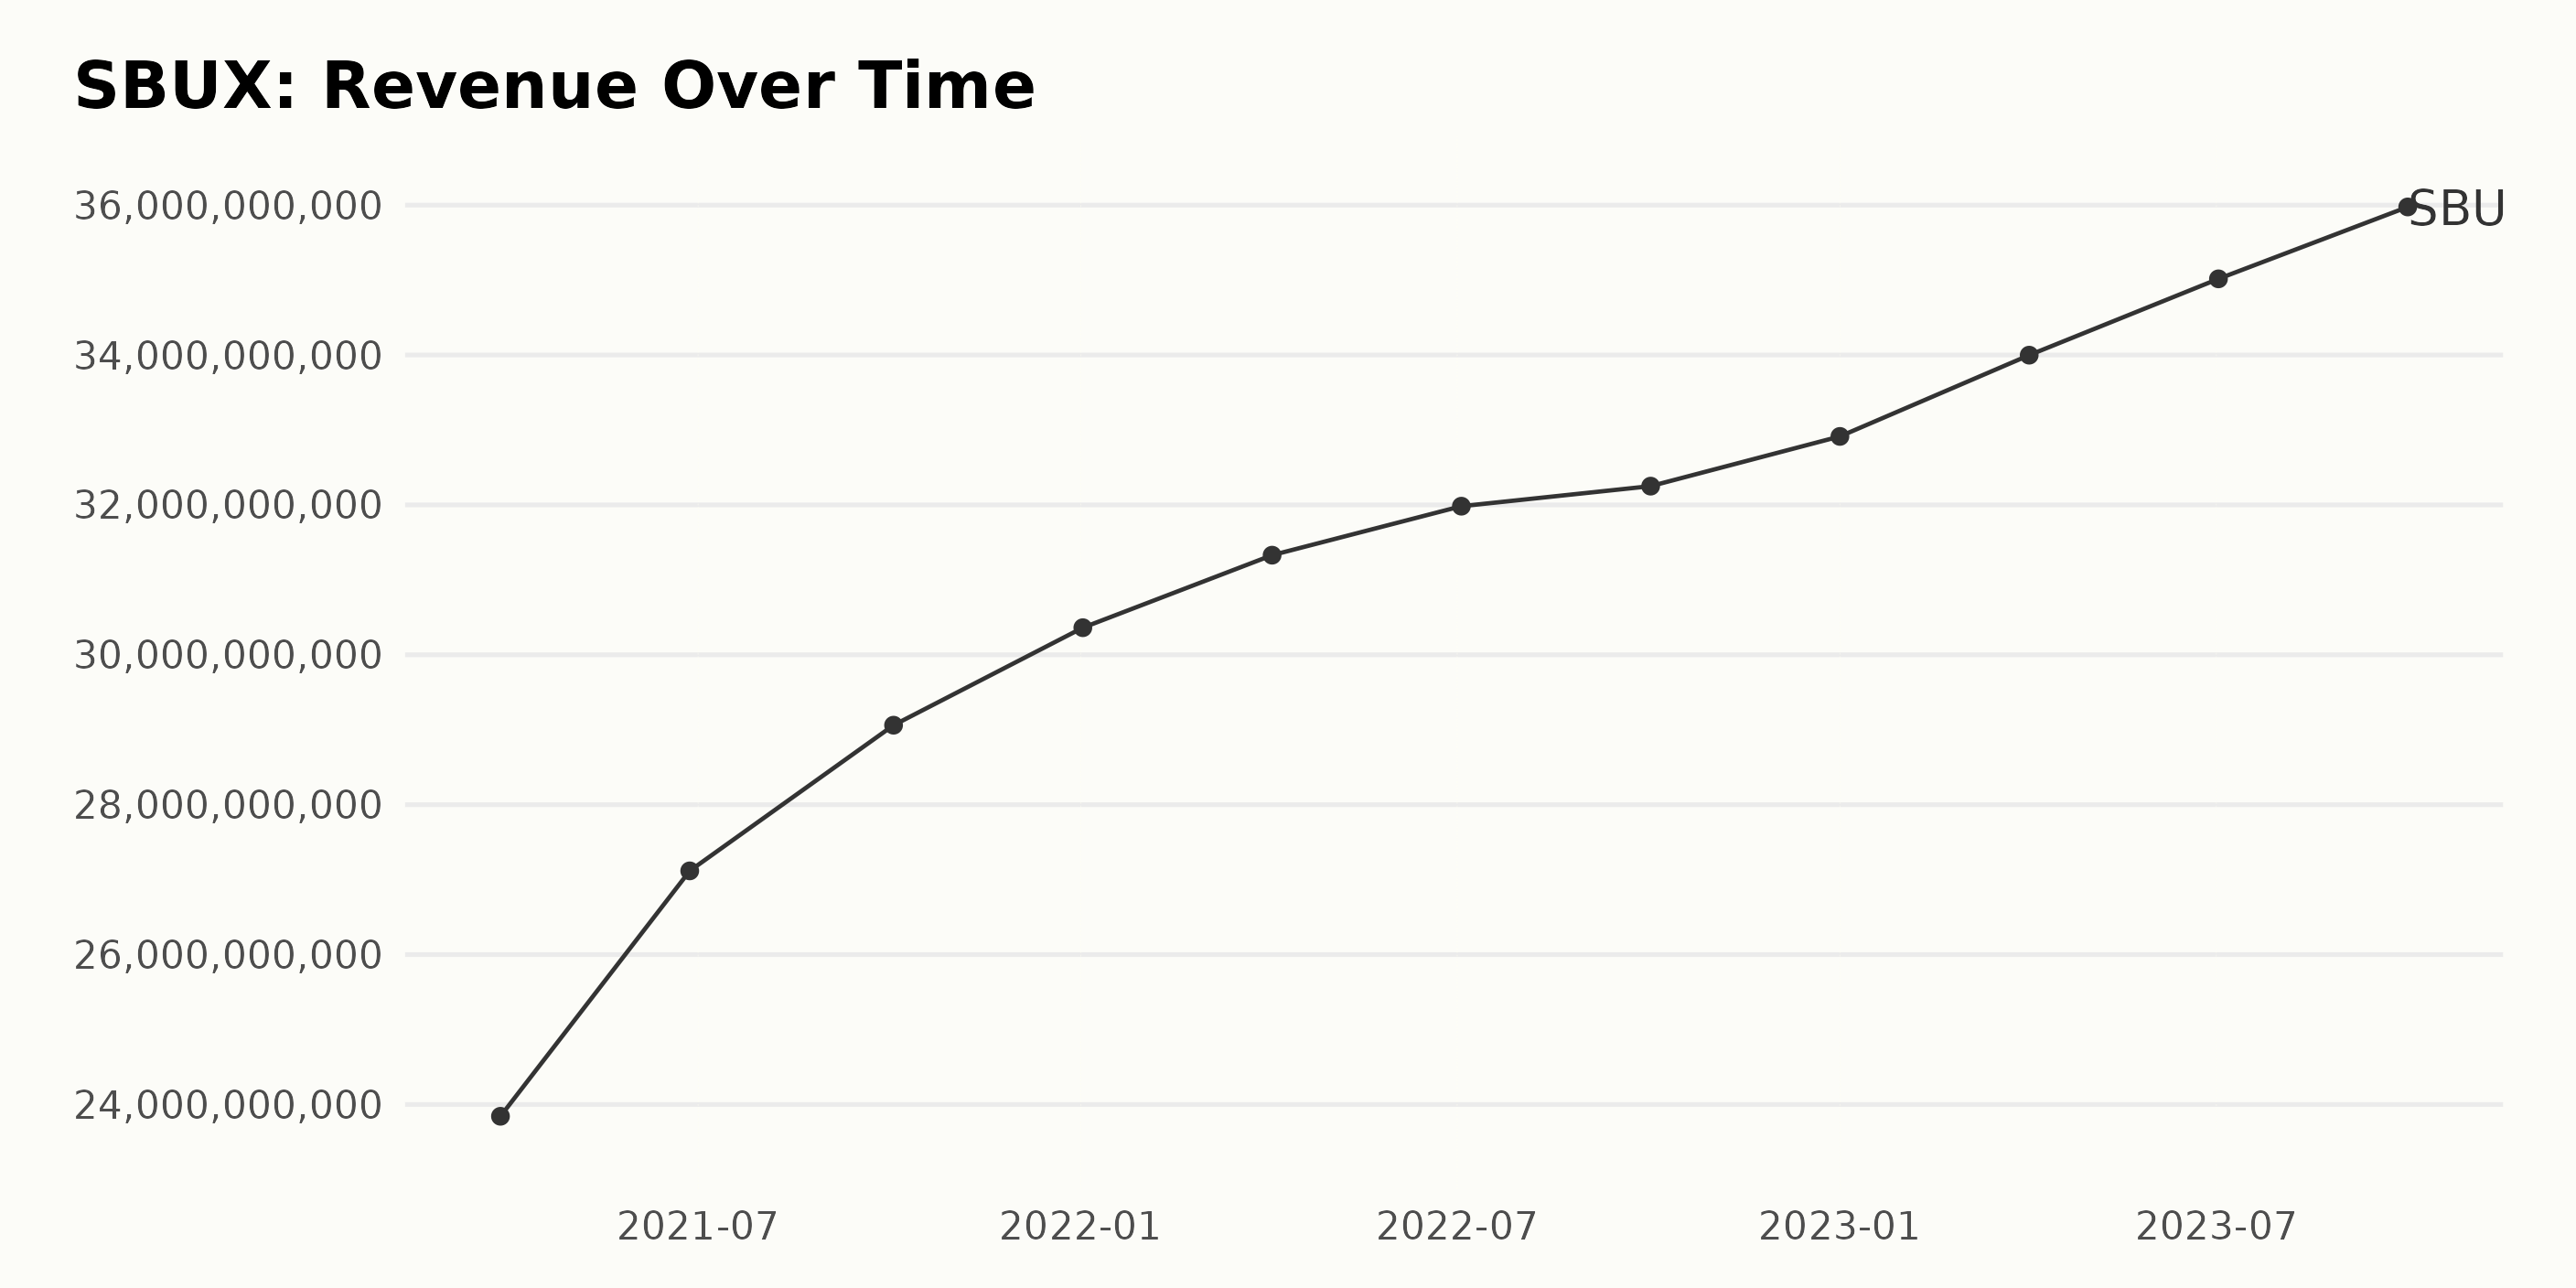
The series of data represents the evolution of the Current Ratio for Starbucks Corporation (SBUX) from December 2020 up until October 2023.
- Starting with a value of 1.06 on December 27, 2020, the Current Ratio experienced a slight increase, reaching 1.07 by March 28, 2021.
- Subsequently, it saw a marginal dip to 1.02 by June 27, 2021.
- A peak followed this decrease; by October 3, 2021, the ratio climbed to 1.2.
- However, from January 2, 2022, a marked downturn ensued as the Current Ratio declined steadily from 0.813, going as low as 0.767 in October that year.
- This trend broadly continued until the beginning of 2023, hitting a low of 0.75 on January 1.
- From April 2, 2023, SBUX’s Current Ratio started to gradually recover, closing at a value of 0.782 on October 1, 2023.
Between the start date in December 2020 and the end date in October 2023, the Current Ratio decreased by approximately 26%, indicating a declining tendency for Starbucks Corporation’s ability to cover its short-term liabilities with its short-term assets over this period. The emphasis on more recent data shows a slight surge in the Current Ratio after hitting the lowest point in January 2023, though the overall performance remains below the starting measure.
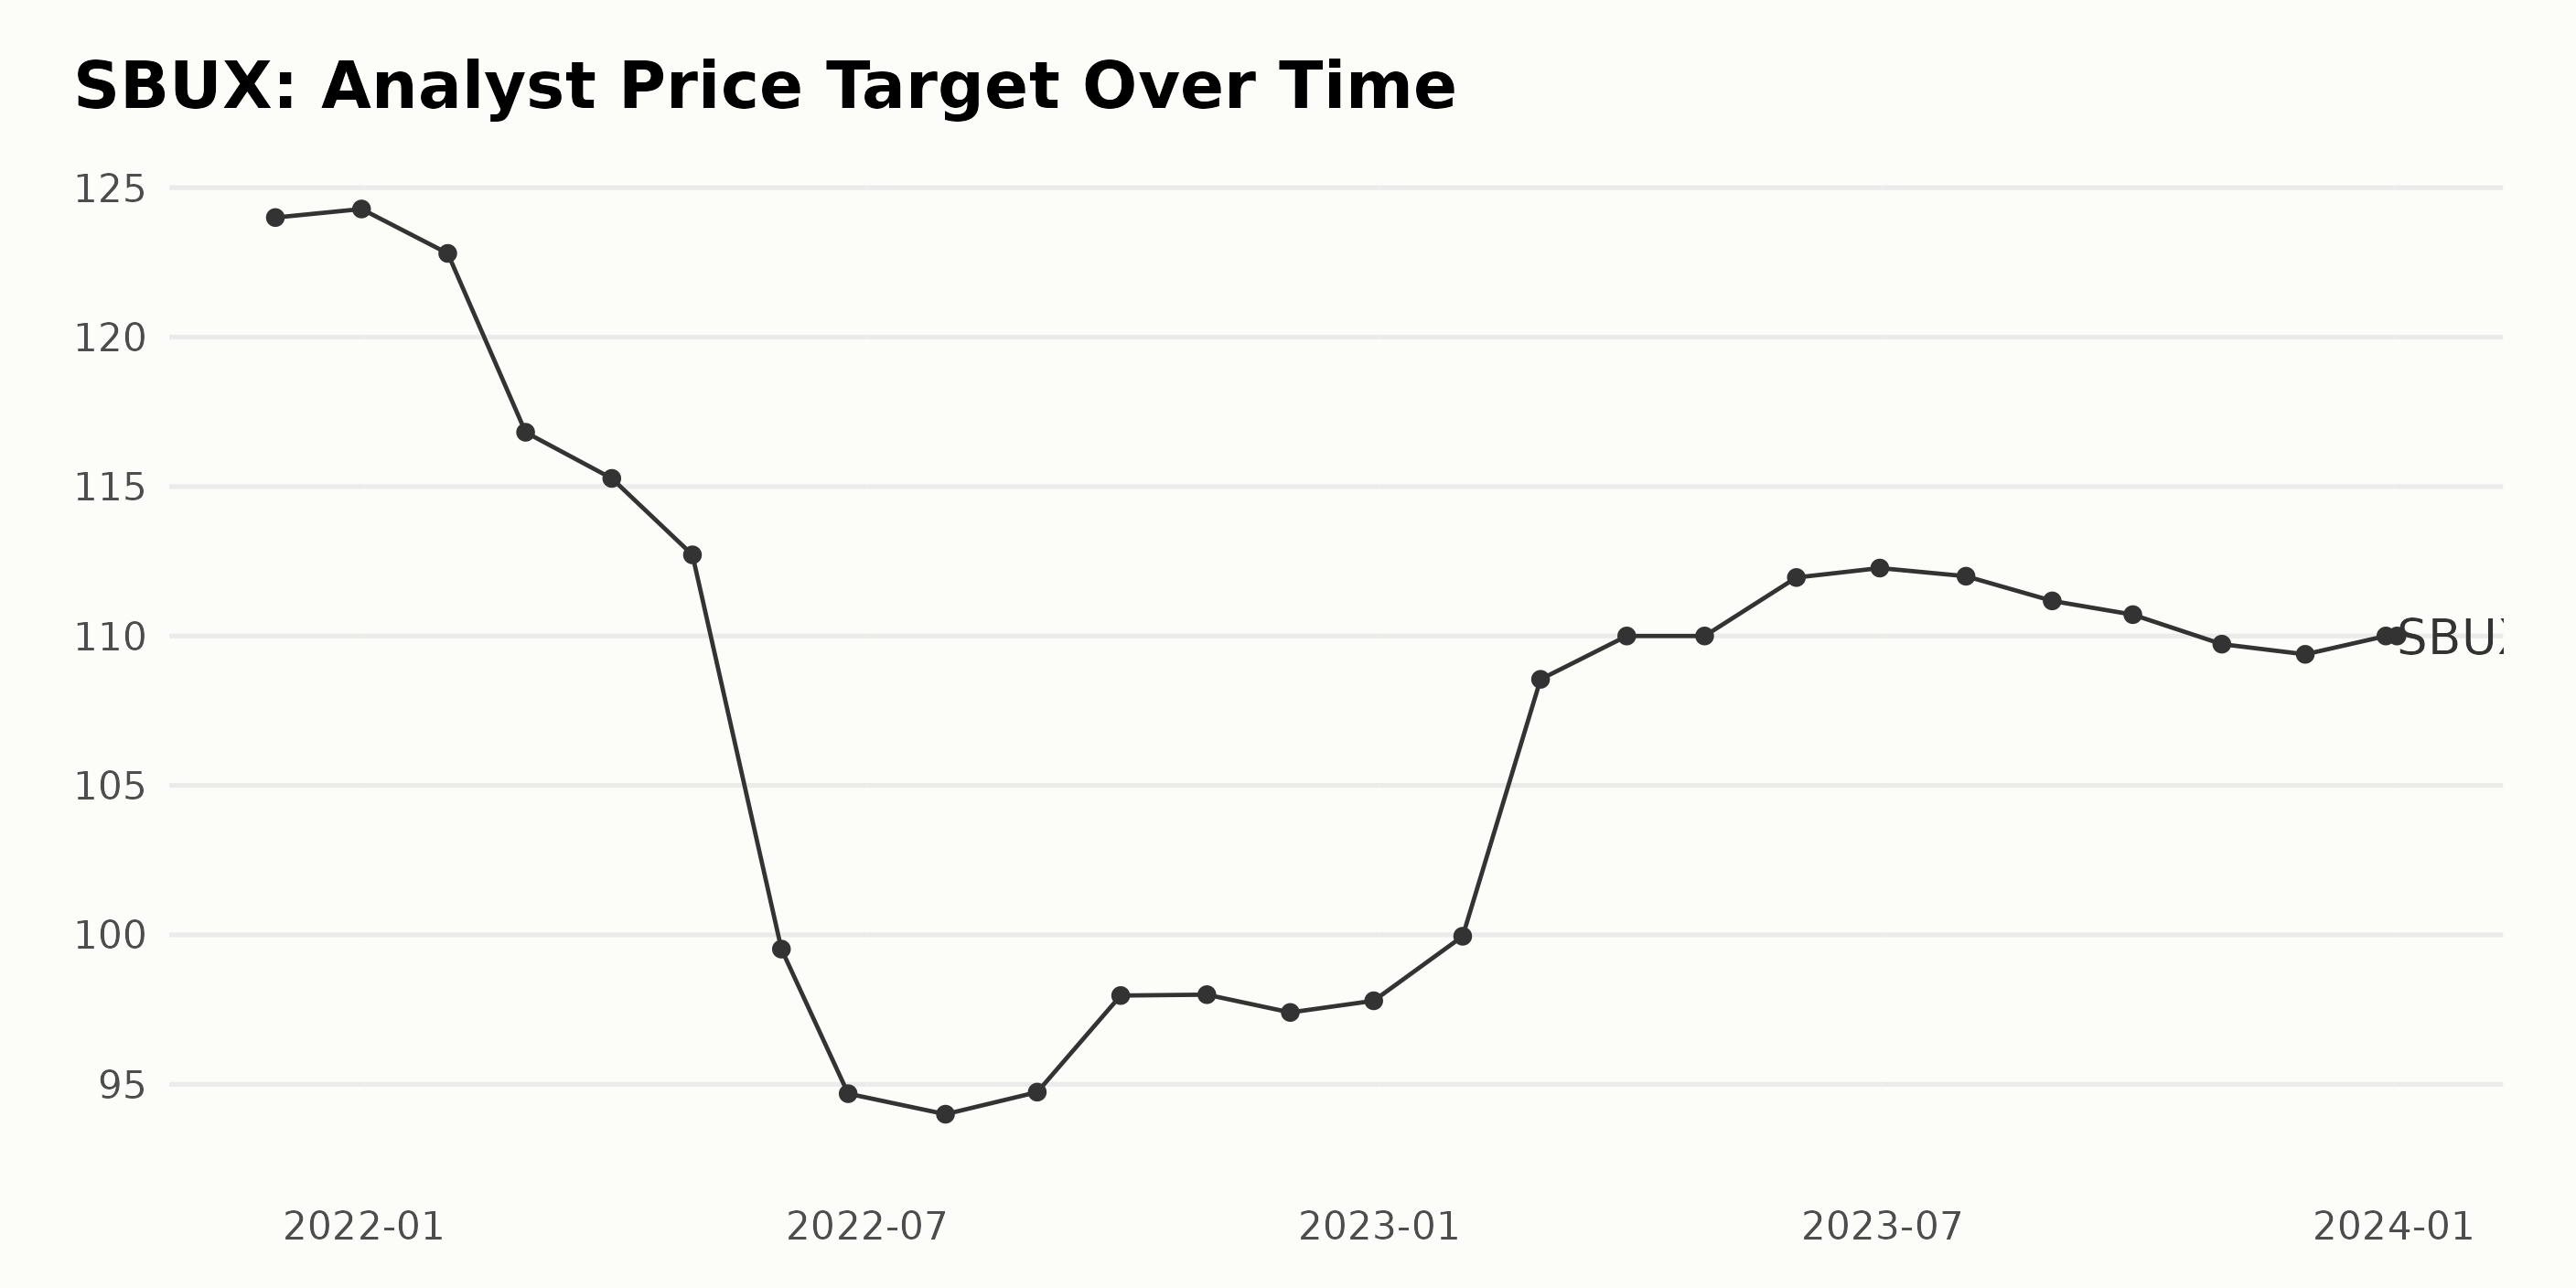
The trend in the Analyst Price Target for Starbucks Corporation (SBUX) indicates some notable fluctuations within the time frame from November 2021 to January 2024.
Herein, a gradual rise from a value of $124 in November 2021 to $124.29 by December 2021 is seen. However, this is followed by declines leading up to May 2022, where the Analyst Price Target hit a low of $99.52.
In June 2022, there was a slight drop to $94.69, but the value relatively stabilized, hinging around $94 and rising slightly to $98 by October 2022. Yet, the target saw a marginal decrease to $97.40 by November 2022. The beginning of 2023 marked a renewed upward trend.
Notably, the Price Target jumped to $108.55 in February, then it gradually rose to $112.27 in June before experiencing minor dips and rises for the rest of the year. By the end of the period in January 2024, the Analyst Price Target settled at $110, representing a decline of approximately 11.29% when compared to the start value in November 2021. Some key data points are:
- Lowest Target: $94 (July 2022) & 94.69 (June 2022)
- Highest Target: $124.29 (December 2021)
- Last Value: $110 (January 2024)
- Growth Rate: -11.29% (From November 2021 to January 2024)
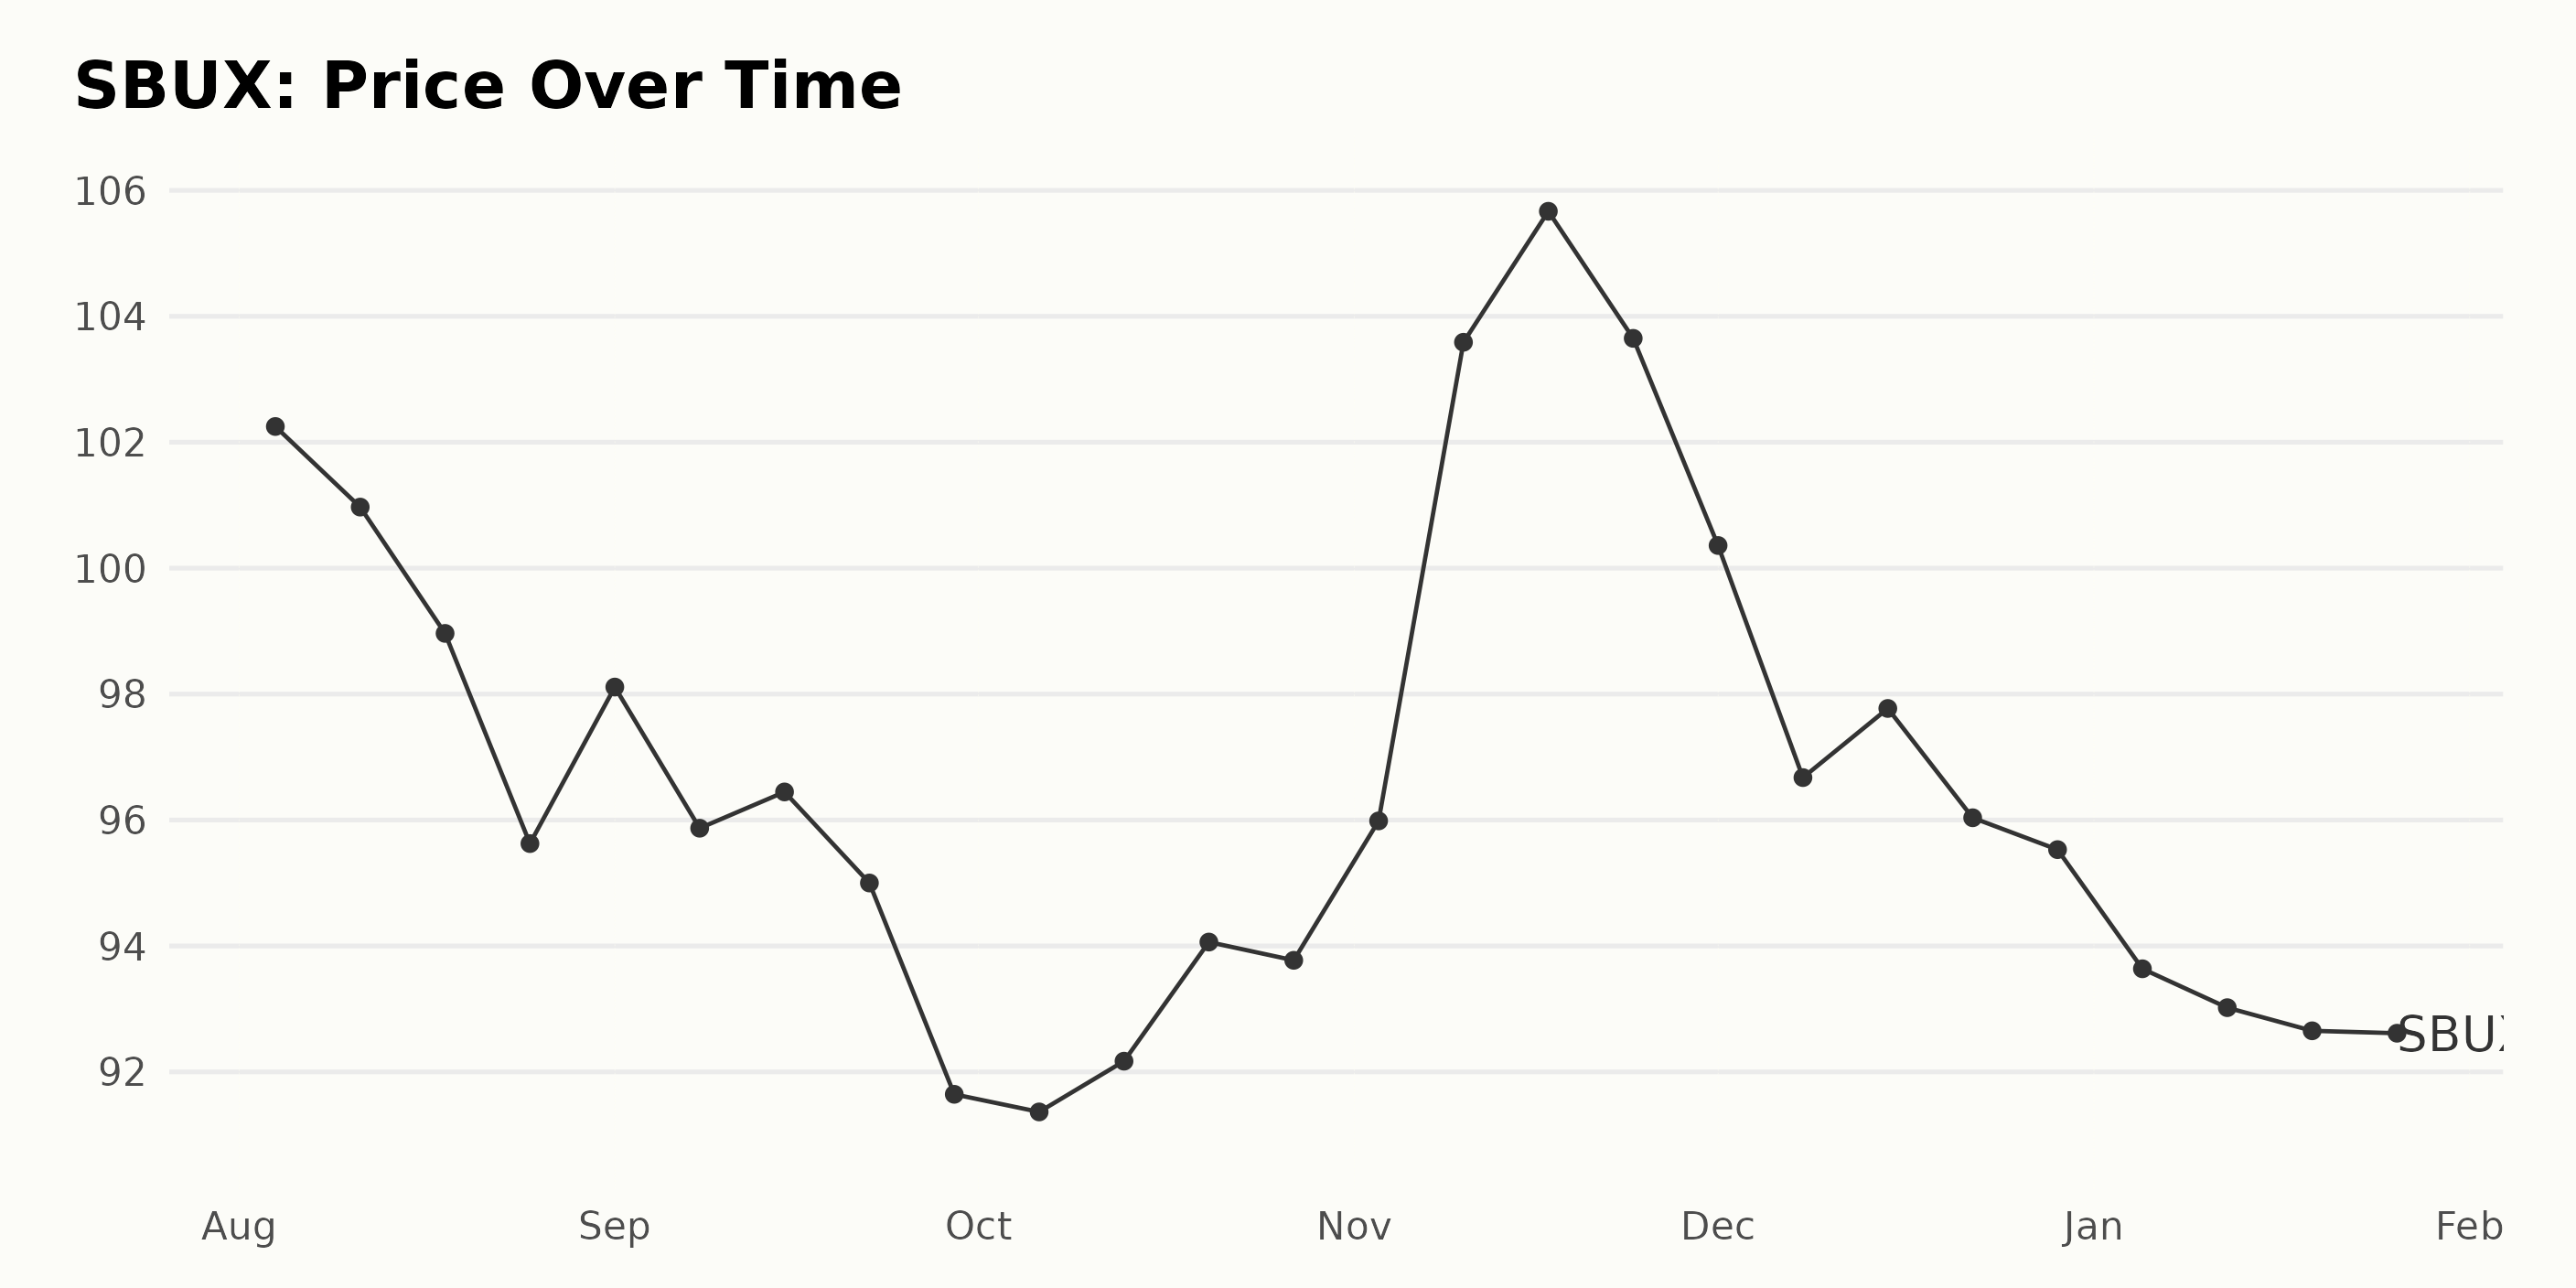
Fluctuating Yet Decelerating Trend in Starbucks' Stock Prices: August 2023-January 2024
The share prices of SBUX show a somewhat fluctuating trend over the period from August 2023 to January 2024:
- On August 4, 2023, the share price started at $102.25.
- There was a consistent decrease in the share prices over the month of August 2023, going down to $95.63 by August 25, 2023.
- In early September 2023, there was a slight rebound as the price rose to $98.11, but the prices fell again to $91.64 by the end of September 2023.
- Throughout October 2023, the share price fluctuated between the range of $91.36 and $94.06.
- There was a significant surge in the prices in November 2023, reaching a peak price of $105.67 on November 17, 2023.
- This surge was followed by a decline towards the end of November 2023 and throughout December 2023, with the price dipping to $95.53 by December 29, 2023.
- In January 2024, the prices further declined, falling to $92.61 by January 26, 2024.
On overall, the data appears to show an overall declining trend in the share prices of SBUX from August 2023 to January 2024, despite a temporary spike in November 2023. However, this is not a consistent declining trend and there are periods of price increase within this timeframe. Therefore, I would characterize it as a decelerating trend due to the overall lower lows and lower highs. Here is a chart of SBUX's price over the past 180 days.
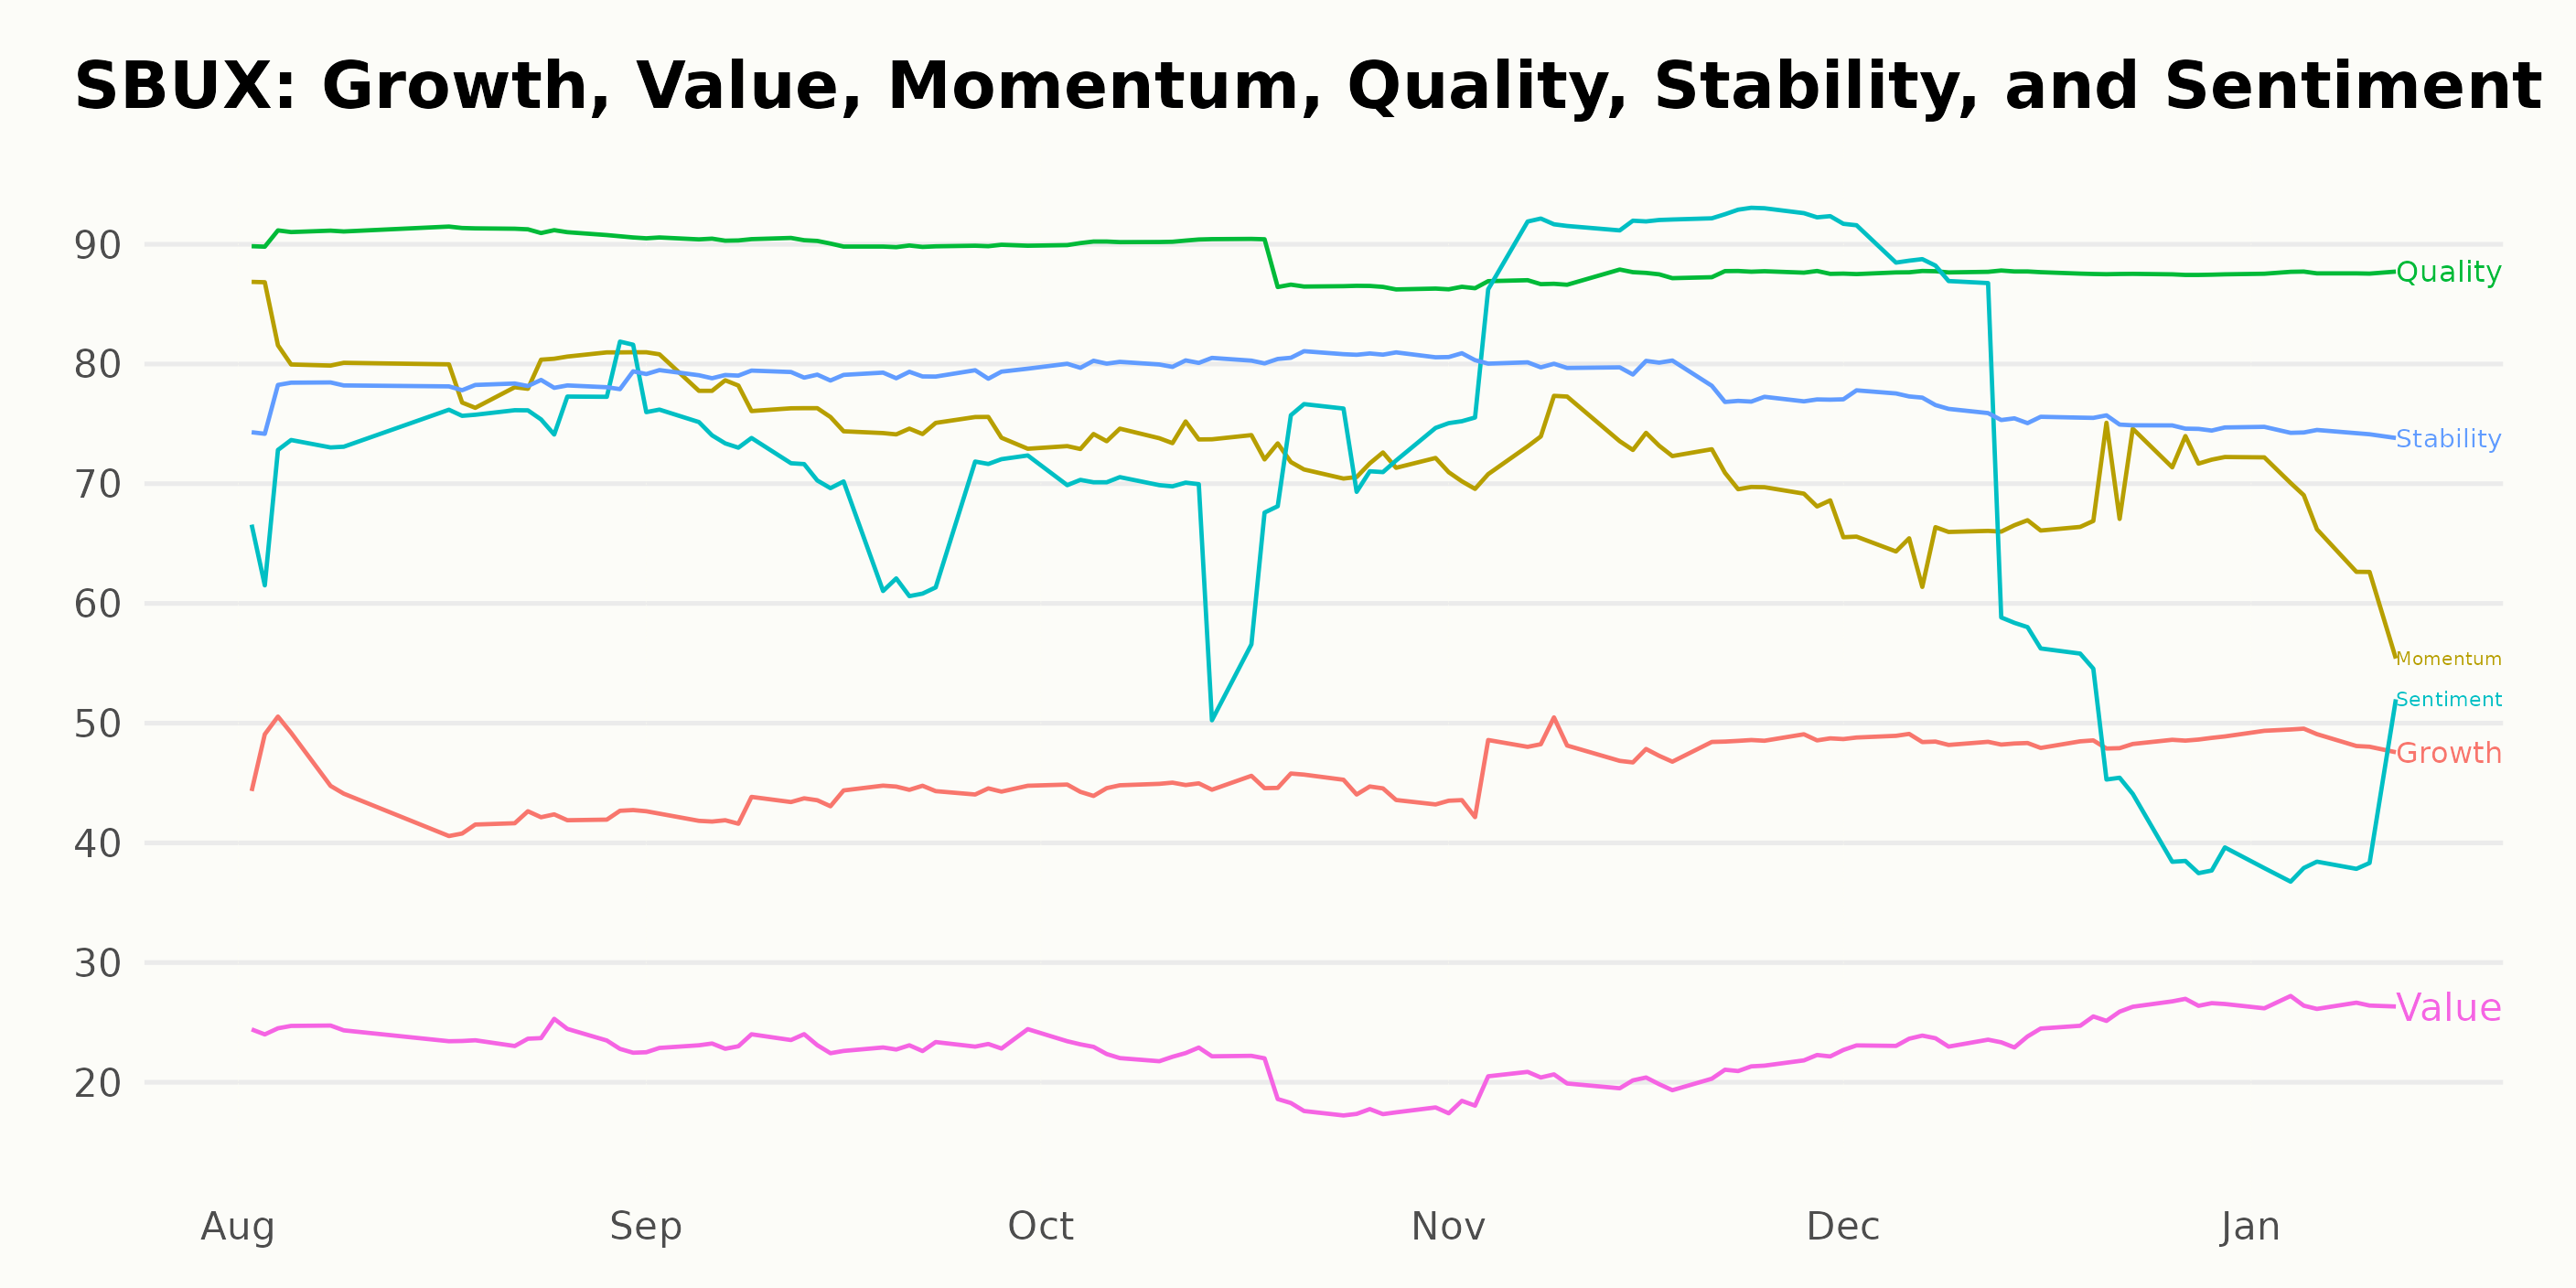
Starbucks' Power Ratings: Analyzing Quality, Momentum, and Stability Trends
SBUX has an overall C rating, translating to a Neutral in our POWR Ratings system. It is ranked #15 out of the 42 stocks in the Restaurants category.
The POWR Ratings for SBUX reveal interesting insights along various dimensions. The three most noteworthy dimensions over the evaluated period are Quality, Momentum, and Stability.
- Quality: This dimension consistently scores high for SBUX. In August 2023, quality stands at a noteworthy rating of 91 and it maintains strong values throughout the year. Even though it exhibits a slight downward trend, ending at 88 in January 2024, this is still a significantly high rating.
- Momentum: Initially, in August 2023, momentum holds an impressively high rating of 81. However, over the next few months, it reveals a clear downward trend. From September 2023 to January 2024, the momentum rating decreases from 76 to 65.
- Stability: This dimension shows slight fluctuations while maintaining reasonably high ratings throughout. It starts with a strong rating of 78 in August 2023 but ends with a reduced score of 74 in January 2024 despite reaching a peak of 80 in October 2023.
These patterns provide valuable information about Starbucks Corporation's quality, its recent trend in momentum, and enduring stability amidst variations.
How does Starbucks Corporation (SBUX) Stack Up Against its Peers?
Other stocks in the Restaurants sector that may be worth considering are Rave Restaurant Group Inc. (RAVE), Nathan’s Famous Inc. (NATH), and Domino’s Pizza Group plc (DPUKY) — they have better POWR Ratings.
What To Do Next?
43 year investment veteran, Steve Reitmeister, has just released his 2024 market outlook along with trading plan and top 11 picks for the year ahead.
SBUX shares were trading at $93.26 per share on Monday afternoon, up $0.46 (+0.50%). Year-to-date, SBUX has declined -2.86%, versus a 2.83% rise in the benchmark S&P 500 index during the same period.
About the Author: Subhasree Kar

Subhasree’s keen interest in financial instruments led her to pursue a career as an investment analyst. After earning a Master’s degree in Economics, she gained knowledge of equity research and portfolio management at Finlatics.
Starbucks (SBUX): Strategies Ahead of Quarterly Earnings StockNews.com