It’s been a year marked by pain and misery for the bulls, but at least one area has been trading well, at least lately: solar stocks.
While the energy sector has done well in 2022 — it’s the best-performing group by a mile — that has not included solar stocks.
This group has struggled in 2022, with the Invesco Solar ETF (TAN) seeing a 45% peak-to-trough decline from its November 2021 high to its 2022 low in May.
That said, the ETF is now positive on the year, with the shares up about 9%.
Solar stocks have now gained in three straight months. While that stretch includes a tick higher of just 0.4% in June, it also includes a 10.7% gain in May and a near-20% gain in July. Further, the TAN ETF did not make new lows in June, while the overall market did.
Positive talks out of Washington are helping the group.
And Enphase Energy (ENPH) reported earnings last week. The stock erupted more than 17% on July 27 and has climbed in each session since. After hitting new highs in today’s session, Enphase stock is up more than 34% since the company reported earnings.
So not only have solar stocks had relative strength lately, but Enphase delivered a bullish catalyst for the group. Can the rally continue?
Trading Solar Stocks
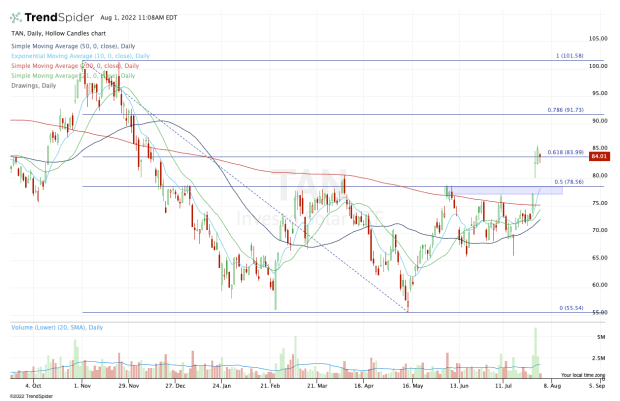
Chart courtesy of TrendSpider.com
I’m looking at solar stocks primarily via the TAN exchange-traded fund. The ETF had been continually rejected by the $77 to $78.50 area for all of June and most of July. That ended on last week’s upside breakout.
Now consolidating near the 61.8% retracement, the TAN ETF suddenly has a ton of strength relative to the energy sector, the S&P 500 and growth stocks.
If the TAN ETF trades below $82.50, then we could see the stock dip into a support zone. The post-earnings low from Enphase’s report is near $80 for the TAN ETF. On a dip, that’s one area of interest, as is the 10-day moving average.
But the much more interesting area is prior resistance between $77 and $78.50. To see prior resistance turn to support would be rather bullish in the short term.
On the upside, I’m eventually looking for a push up to the $90 to $92 area. That’s the 78.6% retracement when measuring the 12-month range, and the 50% retracement if we measure from the 2022 low to the 2021 high.
Above $90 and the $100 area becomes of interest. That's roughly where the TAN ETF topped out in the fourth quarter last year.
Trading Enphase Energy Stock
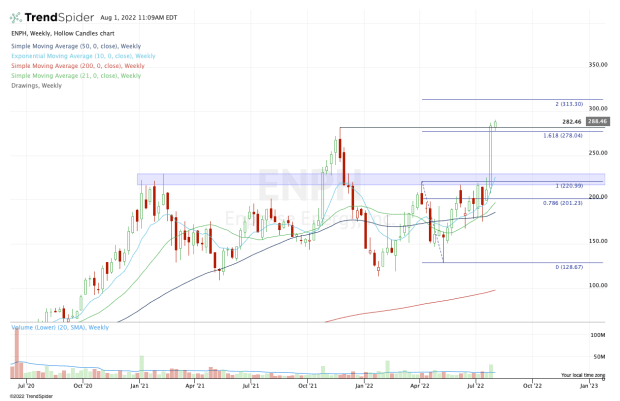
Chart courtesy of TrendSpider.com
Enphase is important, not just because it was the one that kickstarted the recent rally but because it’s the top holding in the TAN ETF.
For this stock, I am looking at a weekly chart, which highlights how it broke out over $220 resistance and, more broadly speaking, the $220 to $230 area, which has been a multiyear resistance area.
With the move, Enphase stock is hitting all-time highs. From here, I would like to see Enphase hold up over $275. That’s a tall order, but if it can do so, the bulls could see a push up toward $300, then the two-times range extension near $313.
If the stock does dip below $275 and specifically it closes below it, keep an eye on the gap-fill level at $257.50 and the 10-day moving average.