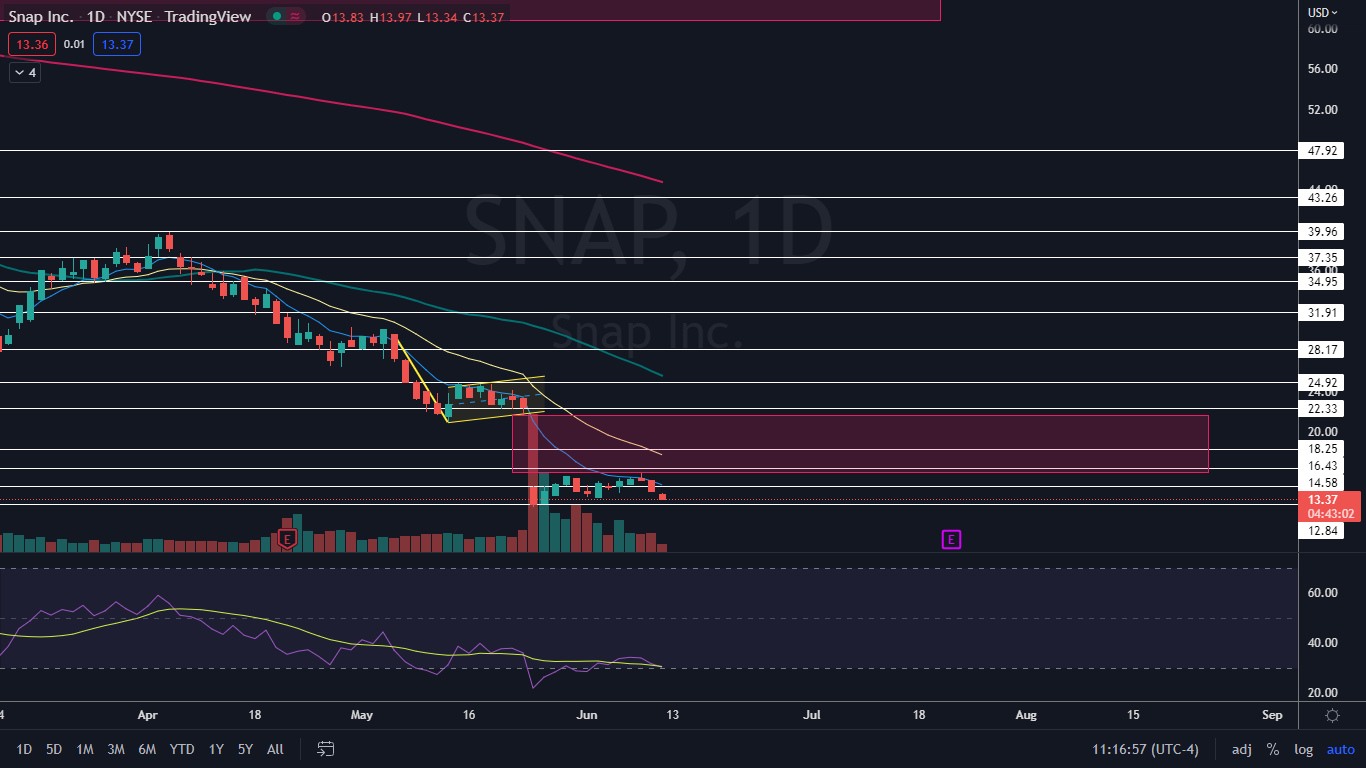
Snap Inc. (NYSE:SNAP) was falling over 2% lower on Friday after siding almost 8% lower on Thursday.
Goldman Sachs analyst Eric Sheridan maintains a Buy rating on the stock, but drastically lowered the price target from $60 to $25. The lower target still suggests about 86% upside potentially for Snap, but the stock looks like it's headed lower due to negating the uptrend it had been trading in since May 24.
If Snap drops lower but can hold above support at the 52-week low of $12.55, the stock may form a triple bottom pattern, which could provide bullish traders at least a short-term trade.
A double or triple bottom pattern is a reversal indicator that shows a stock has dropped to a key support level, rebounded, back-tested the level as support and is likely to rebound again. It is possible the stock may retest the level as support again creating a triple bottom or even quadruple bottom pattern.
The formation is always identified after a security has dropped in price and is at the bottom of a downtrend whereas a bearish double top pattern is always found in an uptrend. A spike in volume confirms the double bottom pattern was recognized and subsequent increasing volume may indicate the stock will reverse into an uptrend.
- Aggressive bullish traders may choose to take a position when the stock’s volume spikes after the second retest of the support level. Conservative bullish traders may wait to take a position when the stock’s share price has surpassed the level of the initial rebound (the high before the second bounce from the support level).
- Bearish traders may choose to open a short position if the stock rejects at the level of the first rebound or if the stock falls beneath the key support level it created the double bottom pattern at.
Want direct analysis? Find me in the BZ Pro lounge! Click here for a free trial.
The Snap Chart: Snap negated its uptrend on Friday, when the stock fell below the most recent higher low of $13.54, which was printed on June 2. Although Snap hasn’t yet confirmed a downtrend by forming a lower high under the $15.87 mark, negating the uptrend has left bullish traders in a period of indecision.
- Bullish traders will be watching to see if Snap can print a reversal candlestick at or above the 52-week low, which could indicate a trend change to the upside is on the horizon. Bearish traders will want to see Snap drop below that level, which could add selling pressure and accelerate a move to the downside.
- There is exaggerated bullish divergence on Snap’s chart, which indicates a bounce is likely to come over the next few days. Exaggerated bullish divergence occurs when a security’s relative strength index (RSI) makes a series of higher lows the stock trades mostly flat.
- Snap has a gap above on its chart between the $15.87 and $21.71 mark that was left behind on May 20. Gaps on charts fill about 90% of the time, which makes it likely Snap will rise up to fill the empty trading range in the future.
- Snap has resistance above at $14.58 and $16.43 and support below at $12.84 and the psychologically important $10 mark.