Wednesday's trading session was very interesting in that we finally saw some selling pressure in megacap tech and the Nasdaq.
Overall, the index sank 1.3% on the day.
That decline didn’t, however, spread throughout the market. While the S&P 500 slipped 0.4%, other indexes, like the Dow Jones Industrial Average and the Russell 2000, gained on the day.
Don't Miss: Did Palantir Stock's Momentum Just Run Out?
Specifically, the Russell ripped 1.8% on the day, following on from a 2.7% rally on Tuesday and a 3.5% rally on Friday.
That said, the ride has been bumpy. The Russell 2000 fell 1.3% on Monday following Friday’s big gain and is down almost 1% so far on Thursday following yesterday’s big gain.
Investors have been selling megacap tech like Nvidia (NVDA), Amazon (AMZN), Apple (AAPL) and others and rotating into small caps like the iShares Russell 2000 ETF (IWM).
The question with this type of rotations is: How long will it last?
Trading the Rotation Into Small Caps
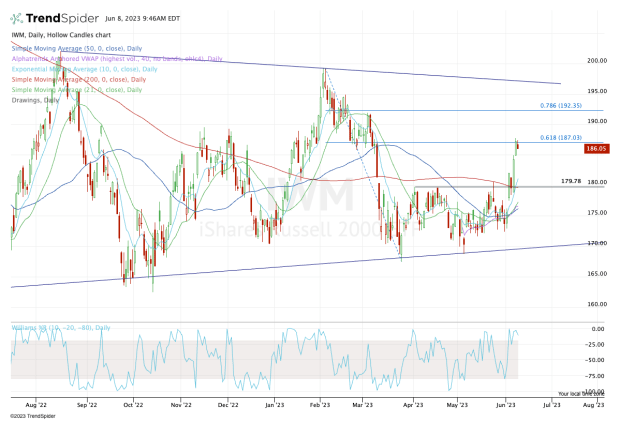
Chart courtesy of TrendSpider.com
A follow-through in small caps and other sectors without excessive megacap selling would be good for the indexes. But if there’s little to no follow-through in the rotation, the trading environment has the potential to get quite choppy.
As for the IWM ETF, Thursday’s action is surely disappointing the bulls. But the Russell has still done quite well in the short term. Even with today’s pullback, the IWM is up almost 7% over the past week.
Right now, it’s running right into the 61.8% retracement. That move follows a powerful breakout over the 200-day moving average and $180 area.
Don't Miss: How Far Can SoFi Stock Rally? Chart Provides a Clue.
In the short term, use Wednesday’s range to help navigate the short-term price action.
For instance, a move below Wednesday’s low of $184.96 (that doesn’t reverse higher) could put more pressure on the IWM. Specifically, it could put the 10-day moving average in play, currently near $181.
If that holds, the active bulls are in control. If it doesn’t, investors will want to see how the IWM handles a retest of the 200-day moving average and the $180 area.
Conversely, a move above Wednesday’s high at $187.77 could open the door up to the 78.6% retracement, near $192.
A rally above this measure puts downtrend resistance in play near $196 (blue line), followed by a push to the year-to-date high at $199.26.
Action Alerts PLUS offers expert portfolio guidance to help you make informed investing decisions. Sign up now.