2014 was Australia’s third-hottest year on record, reflecting a long-term warming trend, according to the Bureau of Meteorology’s annual climate statement.
Here is a summary of the report with six key charts that explain Australia’s climate in 2014:
2014 was hot and Australia is getting hotter
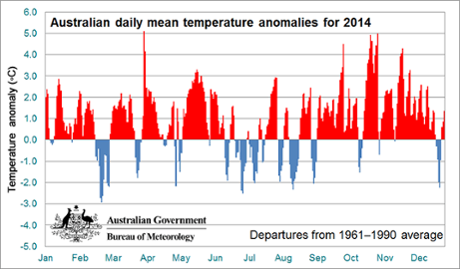
According to the report, seven of Australia’s 10 warmest years have occurred since 2002, and the general trend since 1910 is towards a warmer climate. This graph shows the mean temperature anomaly (degrees difference from a 30-year average temperature) for each year:
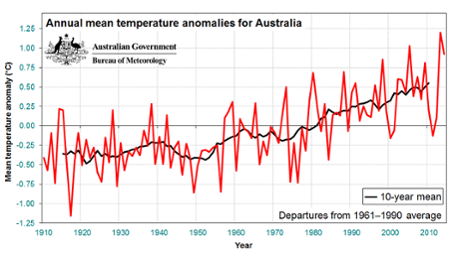
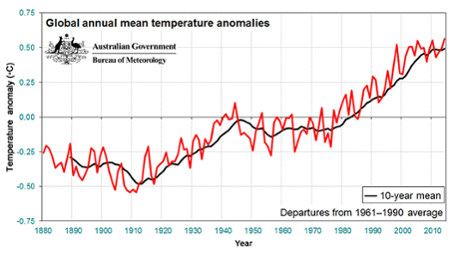
As you can see, more recent years are increasingly above average. This general trend is in line with preliminary estimates for global temperatures for 2014 from the World Meteorological Organisation, which suggest 2014 is likely to be the warmest year on record:
Southern Australia was hotter than average
Overall, the mean temperature for Australia was 0.91C above the 30-year average. However, this was mostly due to the southern parts of Australia, with large areas classified as ‘very much above average’ and some areas, such as southern Victoria, parts of NSW and a decent chunk of WA, experiencing the highest mean temperatures on record:
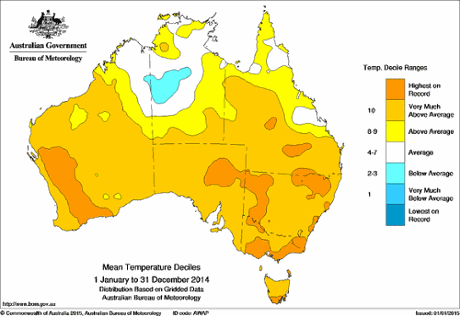
Parts of the Northern Territory were below average, with other sections of north Queensland and NT experiencing average temperatures.
According to the report, it was the warmest year on record for NSW, second-warmest for Victoria, Tasmania and South Australia, equal third-warmest for Queensland and fourth-warmest for Western Australia.
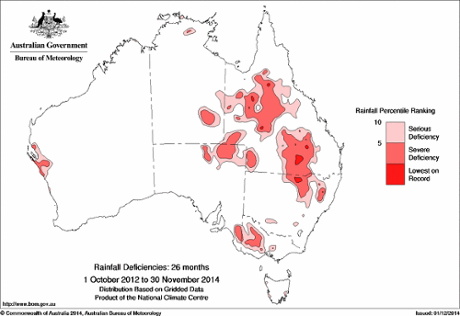
The east was dryer than usual, the centre-west much wetter
While annual rainfall was very much above average for a large section of the NT and WA, regions in Queensland, northern NSW and southern Victoria experienced far lower than average rainfall.
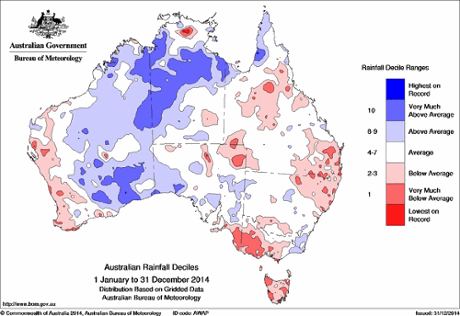
The situation in Queensland is particularly severe; according to the Queensland government, most of the state remains in drought as of December 2014. Here’s the BOM’s rainfall deficiency map over 26 months to November 2014, showing the regions in northern NSW, Queensland and western Victoria that are particularly below average:
Heatwaves, warm spells and bushfires
A number of areas experienced significant heatwaves and warm spells throughout the year, the report highlighting the heatwave of early January as one of the most significant on record for south-eastern Australia.
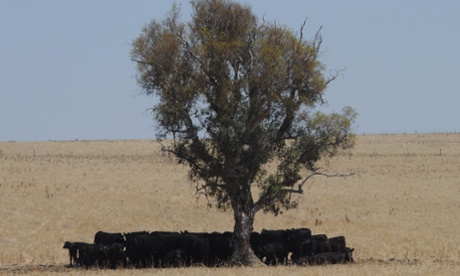
The combination of high temperatures and lower than average rainfall in some regions led to serious bushfires in WA, NSW and Victoria.