Occidental Petroleum (OXY) was up nicely on the day, with a 4.5% gain at the highs on Thursday. However, those gains were cut to just 0.56% at the close as energy prices remain volatile.
That initial rally came on reports that Warren Buffett was again buying more stock. According to a recent SEC filing, Buffett upped his stake by more than $500 million last week.
That brings his total holdings to more than $8.5 billion, good for a 16% stake in the company. Buffett first started buying back in March and has continued to accumulate the stock along the way.
That said, the recent correction in energy prices — with oil down 15.5% from last week’s high and natural gas futures down 36% from its high on June 8 and almost 9% today — has weighed on Occidental Petroleum.
In general though, it has weighed on energy stocks overall. Occidental Petroleum is down about 25% from its recent high, which is roughly in line with the Energy Select SPDR ETF (XLE).
However, there are some hopes that Occidental’s charts could improve going forward and with Buffett being a significant buyer on the dip. Let’s look.
Trading Occidental Petroleum Stock
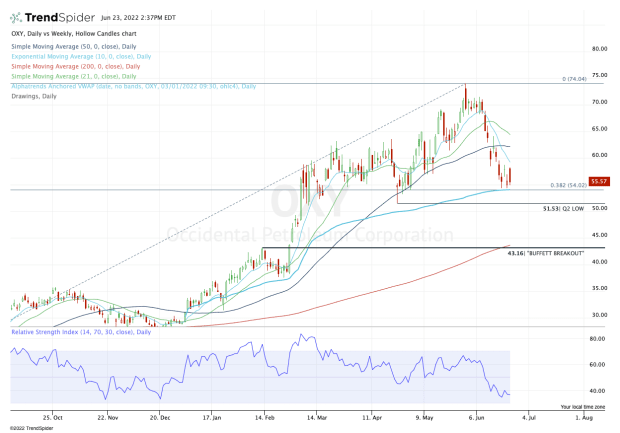
Chart courtesy of TrendSpider.com
Despite having performed incredibly well this year, it’s been a tough run for Occidental Petroleum stock over the past few weeks.
Shares are still up 91% on the year, but the stock has retreated in nine of the past eleven trading sessions. Amid that decline, it has broken below the 10-day, 21-day and 50-day moving averages. The stock closed Thursday at $56.09, up 0.57% on the day.
However, it’s trying to find its footing near an interesting area.
In the $54 to $55 zone, Occidental Petroleum stock has its rising VWAP measure dating back to the start of the year, as well as the 38.2% retracement of the one-year range.
If this area holds as support — just as it has done for the last week — then bulls will want to see it reclaim active resistance by clearing the 10-day moving average and pushing back over $60.
If it can clear $60, Occidental stock can retest its 50-day and 21-day moving averages — and likely in that order.
Should the stock fail to hold the $54 to $55 area as support, then that puts the second-quarter low in play near $51.50. Below that could open the door back down to the “Buffett Breakout” area near $43 and the 200-day the moving average.
And if that happens, you better believe Buffett will be buying the dip as well.