Cruise stocks popped on Thursday’s open, but the rally is running out of steam.
Carnival Cruise (CCL) opened higher by 3.7%, climbed 4.4% at the session high and is currently about flat. Norwegian Cruise (NCLH) rose 4.2% at the start and is now off 2.5%, while Royal Caribbean (RCL) is higher on the day.
Royal Caribbean on Thursday morning reported better-than-expected results. The shares jumped about 9% at the open and were at that level at last glance.
Don't Miss: Solar Stocks Sell Off. Buying Opportunity? Check the Charts.
Even as it reported a loss for the quarter, Royal Caribbean beat analysts' estimates on the top and bottom lines and raised its full-year outlook.
Management's statement that it is “generating significantly more bookings at meaningfully higher prices than in prior years” certainly helps.
Let’s see what the charts are showing us now.
Trading Royal Caribbean Stock on Earnings
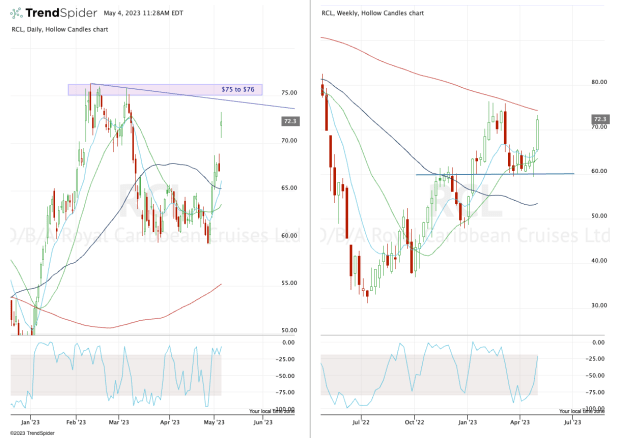
Chart courtesy of TrendSpider.com
On these charts, we are looking at the daily action on the left and the weekly action on the right. On the weekly, notice how $60 was resistance in the fourth quarter but has been support in recent trading.
If the stock moves higher off that strong report, Royal Caribbean will have to contend with the $75 to $76 resistance area.
Along with this zone, Royal Caribbean put in a series of lower highs, while the 200-week moving average has been acting as resistance.
Don't Miss: AMD Stock Drops After Earnings Report. Is It a Buying Opportunity?
If the stock can clear this area, it could enjoy a breakout into the mid-$80s.
On the downside, more selling pressure could put the gap-fill level in play near $67, followed by support at $65. If both levels fail, then $60 is back in play.
Trading Carnival Cruise Stock
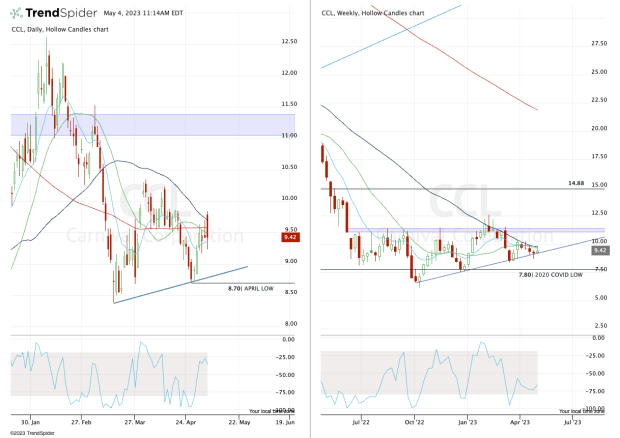
Chart courtesy of TrendSpider.com
The action in Carnival Cruise stock is not as healthy, as the shares are down on the day. In fact, today's action is setting up as a bearish engulfing pattern, where the current day's range engulfs the prior day's range. That's after the shares opened above yesterday's high and then traded below yesterday's low.
If we look at the weekly chart, it tells a pretty clear tale.
The stock remains trapped below the 10-week, 21-week and 50-week moving averages, as they combine to act as stiff resistance. At the same time, Carnival stock continues to grind along uptrend support (blue line).
If either of these measures fail — upside resistance or downside support — then we can get a continued move in the respective direction.
Don't Miss: Take a Bite of Chipotle Stock? Here's Where to Buy the Dip
More specifically, a break of the April low at $8.70 could put $8.37 in play, then the 2023 low just below $8.
On the upside, a move over $9.85 — or $10 for more conservative traders — could put $11, then $11.75, in play.
Action Alerts PLUS offers expert portfolio guidance to help you make informed investing decisions. Sign up now.