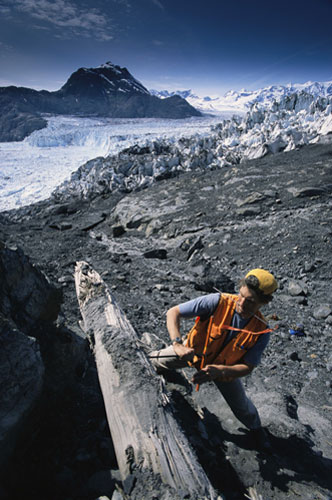
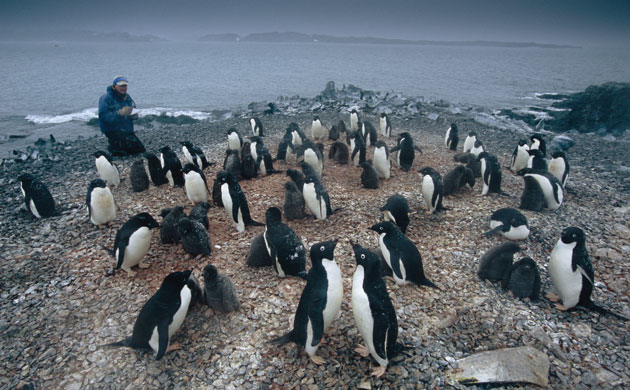
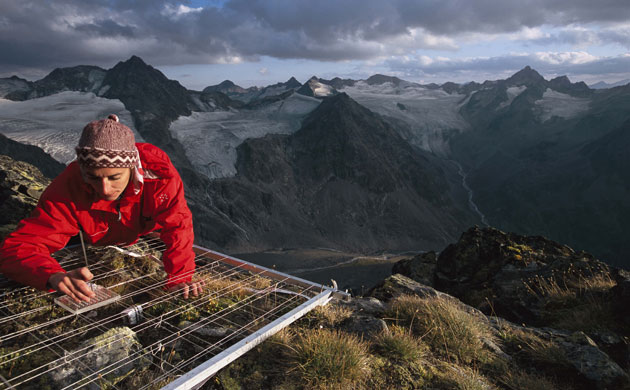
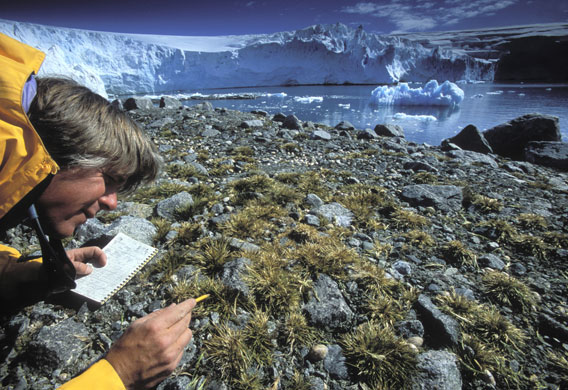
Greg Wiles of Wooster College doing tree ring research in Alaska. These mountain hemlock trees were knocked down by the advancing Columbia glacier around AD1050 and have been revealed as it retreats. The rings can show the movement of the glacier as well as the climate of different periods. The cores and samples are taken to Ohio where the chronology of the growth and death of each tree is determinedPhotograph: Peter Essick/Aurora/GettyBill Fraser researching penguins on Litchfield Island, Antarctica. When he began his research here 30 years ago, there were 1,000 breeding pairs of Adelie penguins – now there are only 20 pairs. There is now no sea ice nearby to support krill, the main food source for the AdeliePhotograph: Peter Essick/Aurora/AuroraDaniela Hohenwallner from the Global Observation Research Initiative in Alpine Environments is counting bryophytes or mosses on Mount Schrankogl, Austria. The plants can be used as an indicator of climate changePhotograph: Peter Essick/Aurora/Getty
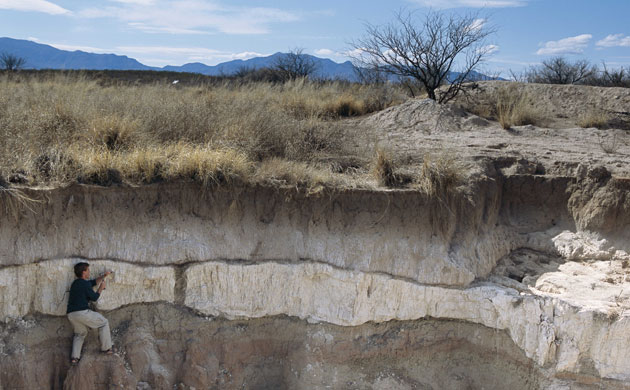
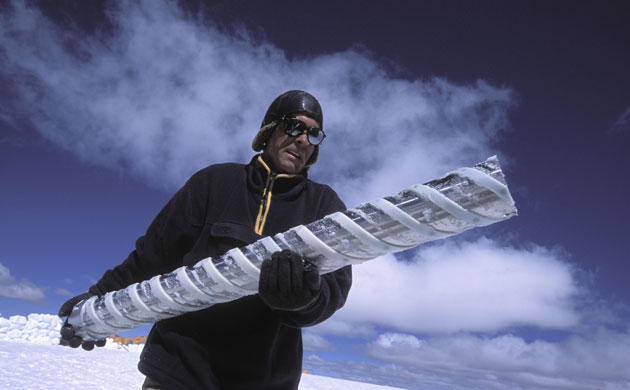
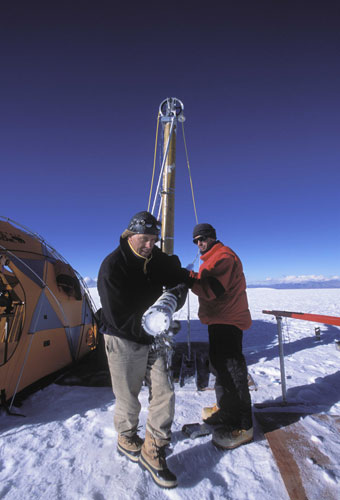
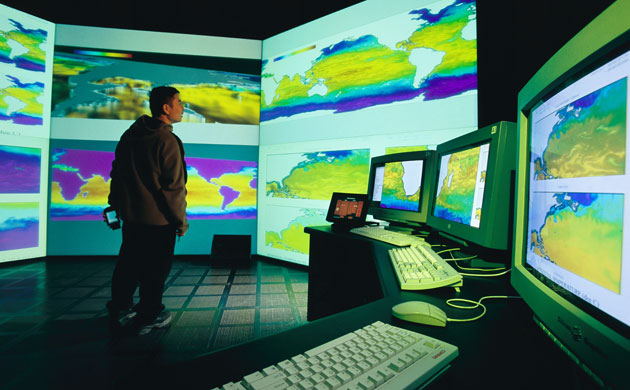
Jeff Pagati researches wetland deposits at Murray Springs, Arizona. The coro marl, the white layer, was deposited during a wet period 15,000 to 40,000 years agoPhotograph: Peter Essick/Aurora/GettyKatie Hein and Dave Harring from Wisconsin university's Center for Limnology measure ice thickness on Lake Mendota, WisconsinPhotograph: Peter Essick/Aurora/GettyTad Day studies the growth of plants at Point 8 near Palmer Station, Antarctica. In 1995 there were no plants here, in 1999 there were 23 cushion plants and 94 grass plants and in 2004 there were 294 cushion plants and 5,129 grass plantsPhotograph: Peter Essick/Aurora/GettyVictor Zagorodnov, a research associate at Ohio State university, carries out ice-core drilling on the summit of Quelccaya ice cap, Peru at 5,670m (18,600 ft)Photograph: Peter Essick/Aurora/GettyVictor Zagorodnov, left, with Patrick Ginot, a student at Ohio State university, ice-core drilling on the summit of Quelccaya ice cap, PeruPhotograph: Peter Essick/Aurora/GettyJason Sun, a research engineering science associate, in the visualisation lab at Texas university's Center for Computational Visualization studying images of the circulation of the oceans produced using data from the Scripps Oceanographic InstitutePhotograph: Peter Essick/Aurora/Getty
Sign up to read this article
Read news from 100’s of titles, curated specifically for you.