Mike Joy says two statistical methods used in a freshwater report are flawed. David Williams reports.
The headline trends made grim reading.
A Government report on freshwater, published last week, said 45 percent of total river length across Aotearoa wasn’t suitable for swimming between 2016 and 2020. When it came to lakes, 45 percent of monitored lakes worsened in health between 2011 and 2020.
For groundwater sites, 68 percent failed drinking water standards at least once between 2014 and 2018. Overall, half the groundwater sites deteriorated in the 10 years to 2018.
READ MORE: * ‘Tricky’ council masks nitrate effect, Mike Joy says * Mike Joy wins battle over ‘dodgy’ water stats
Myriad percentages paired with inconsistent years. But note the precise language, and trends divided into defined periods.
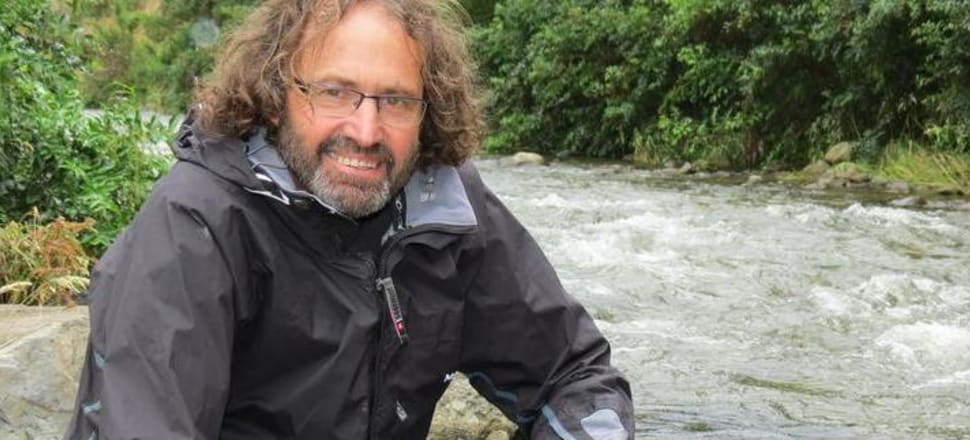
Freshwater ecologist Mike Joy, of Victoria University of Wellington, has been jumping up and down about the misuse of statistics in official environmental reports for years.
He gives credit to Our Freshwater 2023’s authors, saying the reporting is more direct and honest, with less “fudging”.
But there are aspects of the report, compiled by Ministry for the Environment and Stats NZ, which Joy says uses poor methodology that masks the true picture of our degraded waterways.
He has two main issues.
Let’s start with nitrate-nitrogen in groundwater.
In the main, it comes from livestock urine. If humans drink water with high nitrate concentrations it can pose health risks, particularly for bottle-fed babies. Research from Denmark also suggests nitrates in water can lead to increased risk of colorectal cancer.
(In rivers, streams and lakes, nitrates can cause ecological problems by promoting excess plant and algae growth, and, at certain concentrations, can be toxic to fish and other aquatic creatures.)
Our Freshwater 2023 highlights trends of nitrate-nitrogen concentrations at groundwater monitoring sites. At 49 percent of sites the trend is “improving”, while at 35 percent of sites it’s “worsening”.
Click through to the Stats NZ webpage and you find the sample size is 262. (The time period is 2009 to 2018. More on that later.)
Using so few sites is, according to Joy, “just completely nuts”.
He says this is a basic, first-year university stuff-up. There are close to 900 monitored sites in the South Island. Canterbury alone monitors 300 sites. Hundreds more sites are monitored in the North Island.
The report’s “selected” sites are simply those with a full, monthly dataset – or as Joy puts it, “whoever filled out all the forms correctly”. It’s not a random selection and there’s probably some bias in the data, he says.
“You should never sub-sample. The only way you can get an accurate representation of a full population is if your subset is randomly sampled.”
Might that mean the subset presents a glowing picture? “It is definitely better than reality.”
He compares it to a political poll. “If you only ask National Party supporters who they support then that’s what you’ll get.”
Another issue Joy takes with the Our Freshwater report is the “short” time periods, of 10 years, for analysing some trends.
Finding significance in trends relies on data points, Joy says. Shrink the dataset and you shrink the number of data points.
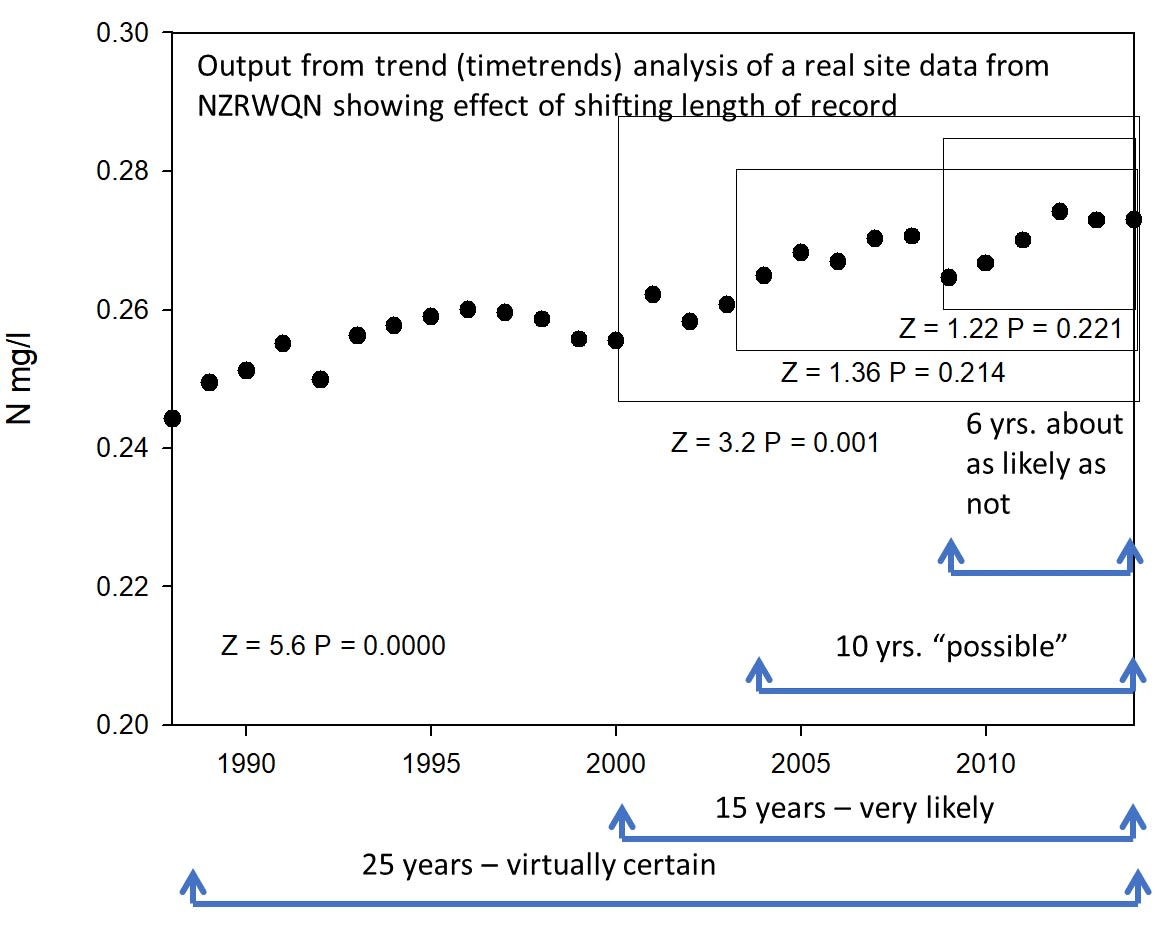
“It’s just about the number of samples,” Joy says. “So the trend, it’s still there, it’s still obvious to the naked eye. It’s still happening.
“But it’s just because you don't have enough data points because you shortened up the time period, then it doesn’t tick this box in the software to say that it’s significant, because it just can’t be sure because it doesn’t have enough examples.”
Joy returns to his political polling analogy.
If you only poll 100 people your margin of error might be plus or minus 20 points. But extend your sample to 1000 people and the margin of error shrinks to about 3 points.
“That’s all it’s about, is that your sample is too small to have the confidence, and it’s too small because you shortened the time period, not because the trend isn’t there.”
The Stats NZ website for groundwater quality contains a note from April 5.
“The groundwater quality indicator is currently undergoing an independent methodological review. A decision about when this indicator will be updated will be made following completion of the review.”
Natasha Lewis, Ministry for the Environment’s deputy secretary of joint evidence, data and insights, says measures are actively being brought in to help record changes in environmental conditions and the effect interventions are having.
“Additionally, we expect the recommendations of the independent methodological review of groundwater indicators will enhance our ability to report on groundwater quality in the future.”
Stats NZ’s general manager of economic and environmental insights Jason Attewell says the freshwater report uses data updated for last year’s Environment Aotearoa report.
“Trends in water quality take time to show any meaningful change,” Attewell says in a statement provided jointly to Newsroom with Lewis’.
“There are fewer sites with 20-year records available, so the report’s focus on the 10-year trend results allowed analysis of more sites covering a wider area.”
Trend analyses over longer periods are available on the Stats NZ website, Attewell says.
Gaps, inconsistencies, inaccessibility
Our Freshwater 2023 has an entire section devoted to data and research gaps. How environmental data is collected and analysed needs improving, its authors admit.
The report said: “There continues to be gaps in data, inconsistencies in methods and monitoring, lack of accessibility, and a gap in elevating mātauranga Māori (Māori knowledge).”
Lewis says the Ministry for the Environment is reforming the environmental reporting system.
“We acknowledge there are still critical gaps in our knowledge base … We are committed to working with our partners to address and improve both environmental monitoring and reporting.”
Many of these issues were identified by the Parliamentary Commissioner of the Environment in 2019, as mentioned by Lewis and the report.
Simon Upton wrote in November of that year: “If there is one thing that stands out from the first cycle of reports [under the Environmental Reporting Act 2015], it is the extent of what we don’t know about what’s going on with our environment.”
He was responding to deficiencies in assessments and data in Environment Aotearoa 2019.
This year’s latest admissions of gaps in our environmental reporting seem to be yet another case of shrinking the dataset.
In September 2019, the Auditor-General John Ryan called for improved national-level reporting about freshwater.
“The shortcomings in national-level reporting are caused in part by complexities in using regional council data to form a national picture. There are also significant gaps in knowledge about the effects of poor freshwater quality, including the effects to pollution on te ao Māori and human health. These issues need to be addressed.”
In 2017, in its review of New Zealand’s environmental performance, the OECD said more national monitoring, data collection and research would help guide freshwater management policy.
The OECD report referred, in turn, to former Parliamentary Commissioner for the Environment Jan Wright’s commentary on Environment Aotearoa 2015, the first comprehensive report prepared under the Environmental Reporting Act.
She picked up that concerns about “swimmability” were omitted from the report because its authors were worried about accuracy.
“If an issue is important, ways to report on it should be found even when the data is limited,” Wright wrote.
Later in her report, Wright said it was important the national environment reporting team worked with regional councils and other experts to standardise data collection and analytical methods.
Let’s wind the clock back to 1997, and the country’s first state of the environment report. It said: “The limitations of New Zealand’s environmental data were a frequent challenge in preparing this report.”
Considerable information existed but it was often out of data, confined to a particular time period or location, and different methods used.
The year before that, the OECD cuffed the country for its lack of high-quality environmental data, calling it “a significant barrier to effective environmental planning and management”.
The State of New Zealand’s Environment 1997 said: “Progress is now being made toward overcoming these deficiencies through the Ministry for the Environment’s national environmental indicators programme.”
Now, 26 years later, Lewis, of MfE, says it’s “working to progress reforms to the environmental reporting system, as recommended by the Parliamentary Commissioner for the Environment”.
There’s no doubt progress has been made since 1997, and reports have improved, including added context about the causes and effects of pollution. But without making environmental monitoring and assessment a top priority, and apportioning appropriate funding, might we still be talking about making “progress” in 2050?
Joy, the freshwater ecologist, says these government reports often make recommendations about filling data gaps and doing a better job of certain things, like better representation of mātauranga Māori.
His recommendation is: “Read your own report and do something about it.”