From fast-moving rivers to trickling creeks, scientists around the world work to measure discharge, or the volume of water flowing past a point per second. Discharge is the number that turns "the river is high" into "this could flood downstream," and it underpins everything from reservoir operations to crop planning.
The problem is that gauges are unevenly distributed across the planet, and some of the places where better monitoring matters most — remote regions, fast-changing watersheds, politically complex borders — are often the hardest to measure consistently. That's where Earth-observing satellites come in.
NASA and the French space agency CNES built the Surface Water and Ocean Topography (SWOT) mission to measure the height of water across oceans, lakes, reservoirs and rivers using a wide-swath radar instrument called KaRIn (Ka-band Radar Interferometer). SWOT repeats its global ground track on a regular cycle, providing broad coverage that complements on-the-ground networks.
What is it?
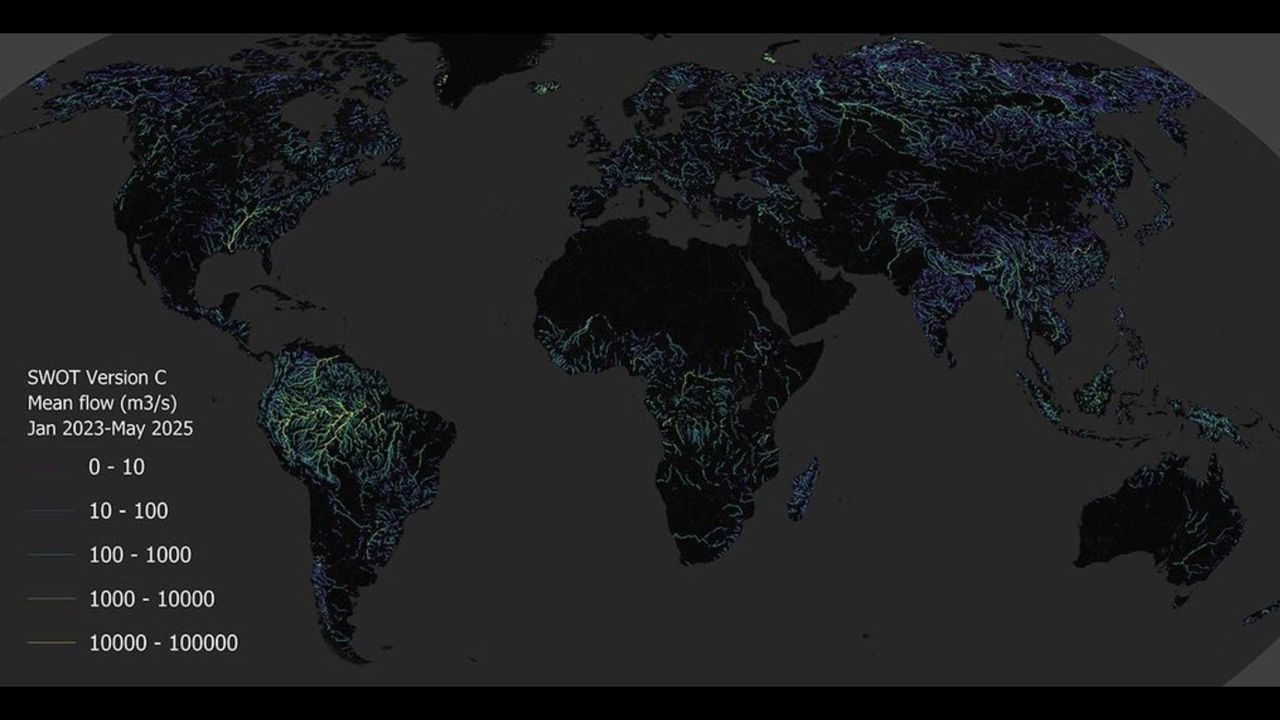
This "rivers of Earth" map is made from SWOT data and shows estimated discharge across river systems worldwide, lighting up continents with blue-to-green threads where water is flowing. The brighter and denser the network, the more major river reaches (and higher flows) are being captured in the estimate.
According to NASA, this release represents the first-ever global estimate of both river discharge and suspended sediment observed from space — covering every river on Earth wider than about 160 feet (50 meters).
Where is it?
The SWOT satellite analyzes Earth from an altitude of 554 miles (891 kilometers). It orbits our planet multiple times a day, retracing its previous path every 21 days. You can track its location in real time here.

Why is it amazing?
With SWOT measurements as the backbone, science teams produced estimates of both river discharge (how much water is moving through a river reach) and suspended sediment concentration (how much material is being carried in the water). Those two together matter, because rivers don't just move water; they also carry nutrients, pollutants and soil, shaping deltas, affecting water quality and influencing ecosystems downstream.
Discharge in particular is the heartbeat of flood forecasting, and having a space-based estimate helps fill gaps where ground sensors are limited or absent. Similarly, water utilities, irrigation planners and reservoir managers can use discharge estimates to understand availability and variability across seasons and regions.
Want to learn more?
You can learn more about Earth-scanning satellites and environmental science.