Earth-observing satellites reveal significant ground shift in central Myanmar following the devastating earthquakes that ravaged the area in March.
The European Space Agency's (ESA) Copernicus Sentinel-1A satellite captured radar images of the country just one day before a powerful magnitude 7.7 earthquake struck on March 28. The Sentinel-1C satellite revisited the site a few days later, capturing the aftermath of the seismic event.
"Using satellite radar images, scientists can map the extent of ruptures and identify areas of increased seismic risk," ESA officials said in a statement.
ESA's Sentinel-1 mission includes two satellites positioned 180 degrees apart in orbit above Earth, enabling them to collectively scan the entire globe every six days. Sentinel-1's advanced radar imaging capabilities, including Terrain Observation with Progressive Scans and burst overlap interferometry, allow for precise measurement of ground motion in both east-west and north-south directions.
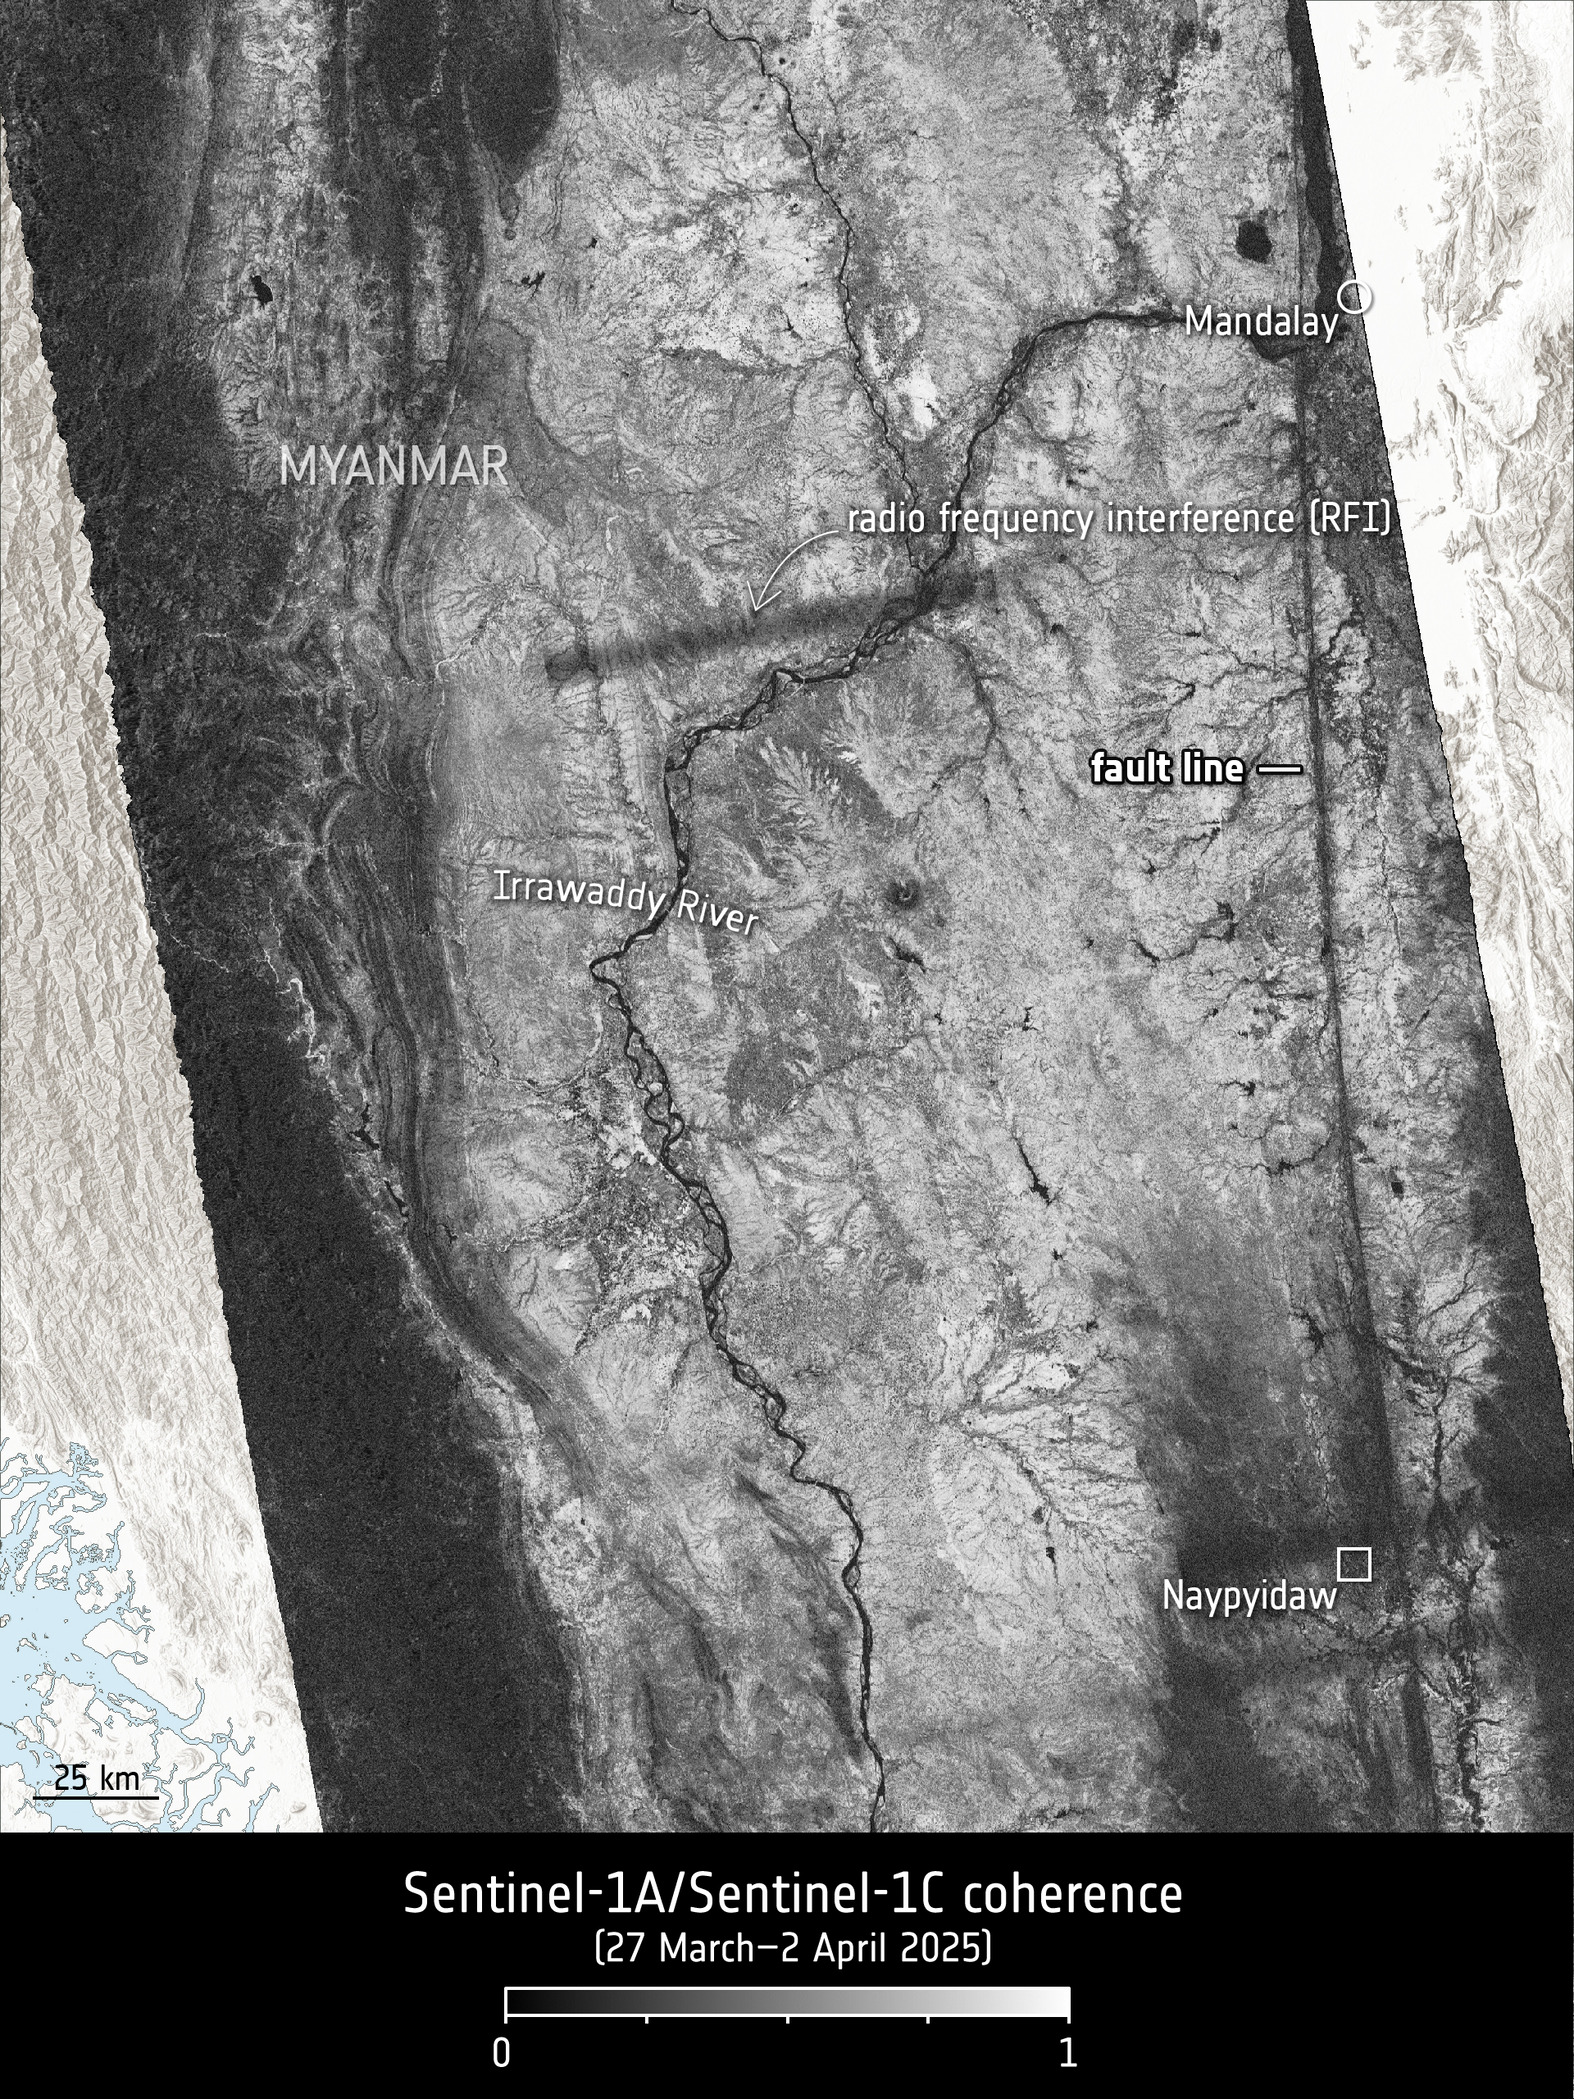
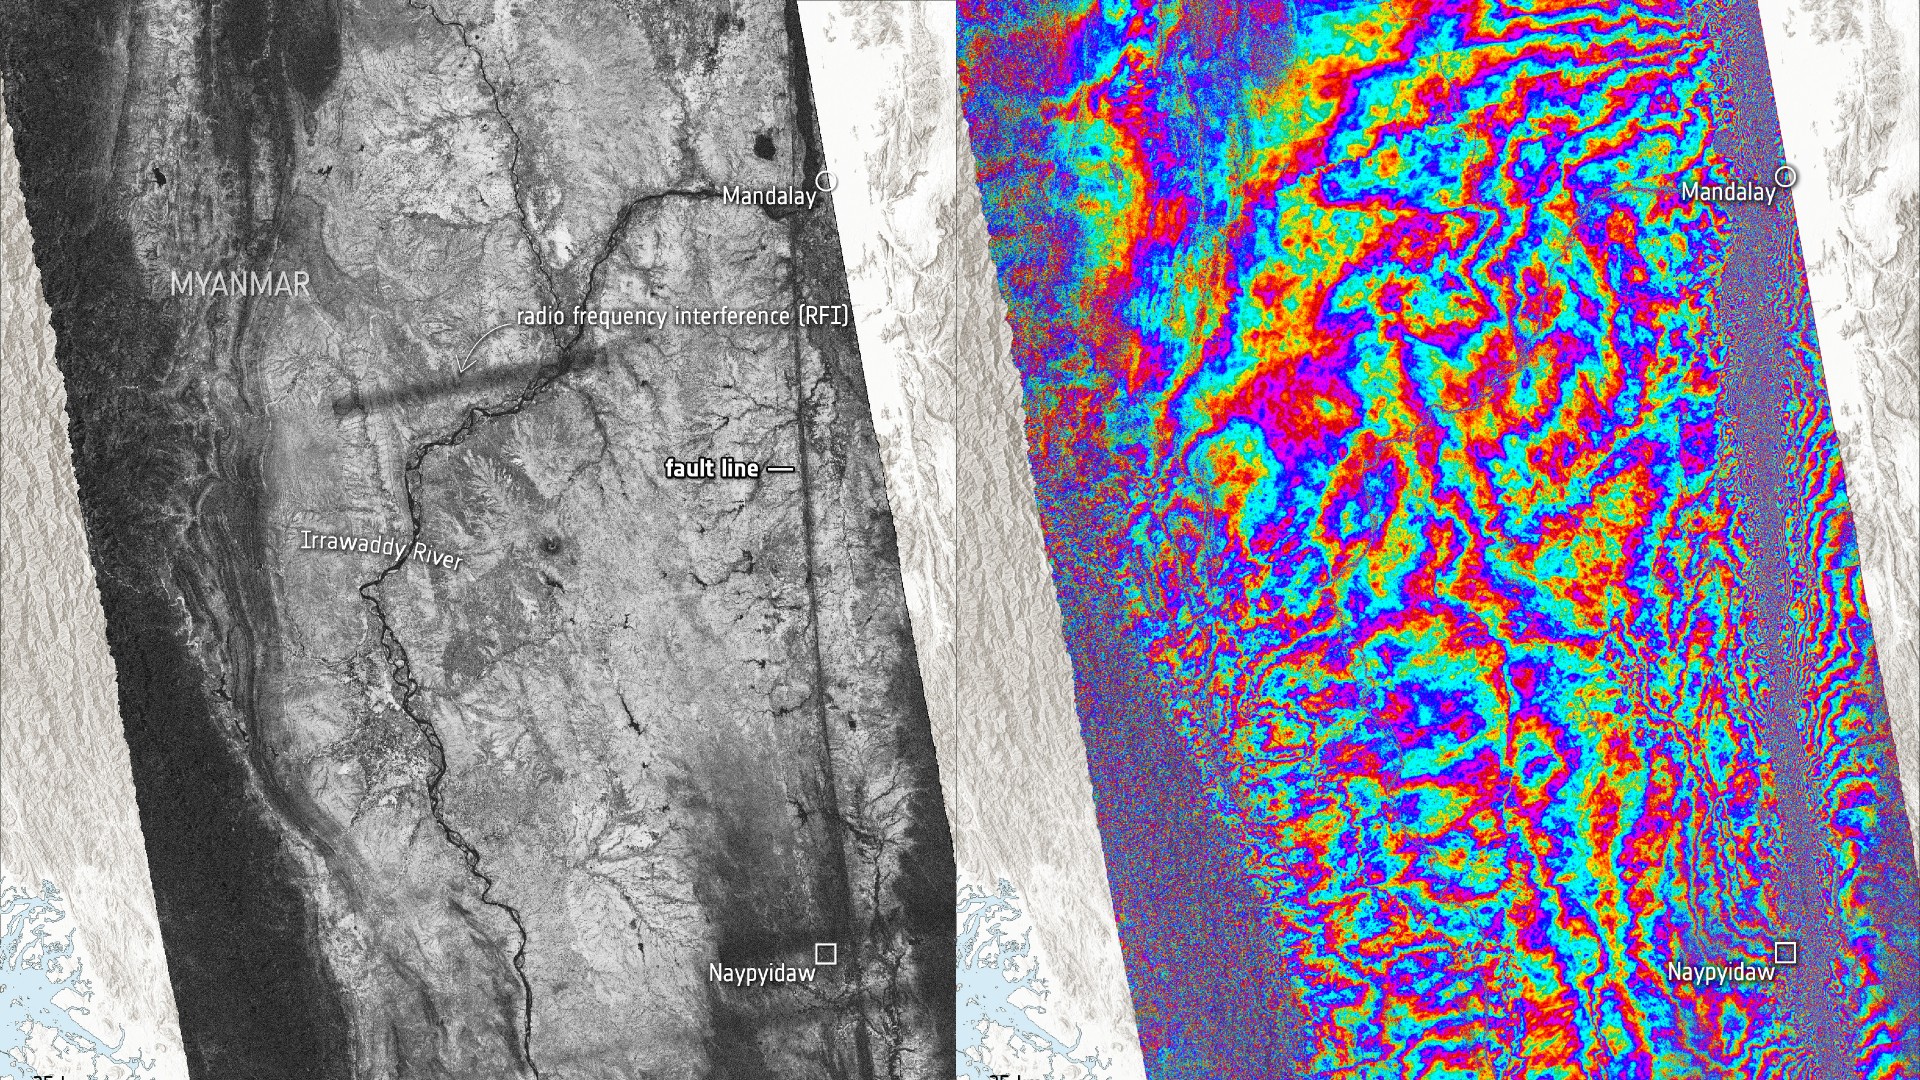
By comparing the satellite data collected before and after the Myanmar earthquake (a method called synthetic aperture radar interferometry), scientists were able to create a detailed map illustrating ground movement, also known as an interferogram, along the Sagaing Fault — one of the most active strike-slip faults in Southeast Asia, running north to south through the center of Myanmar.
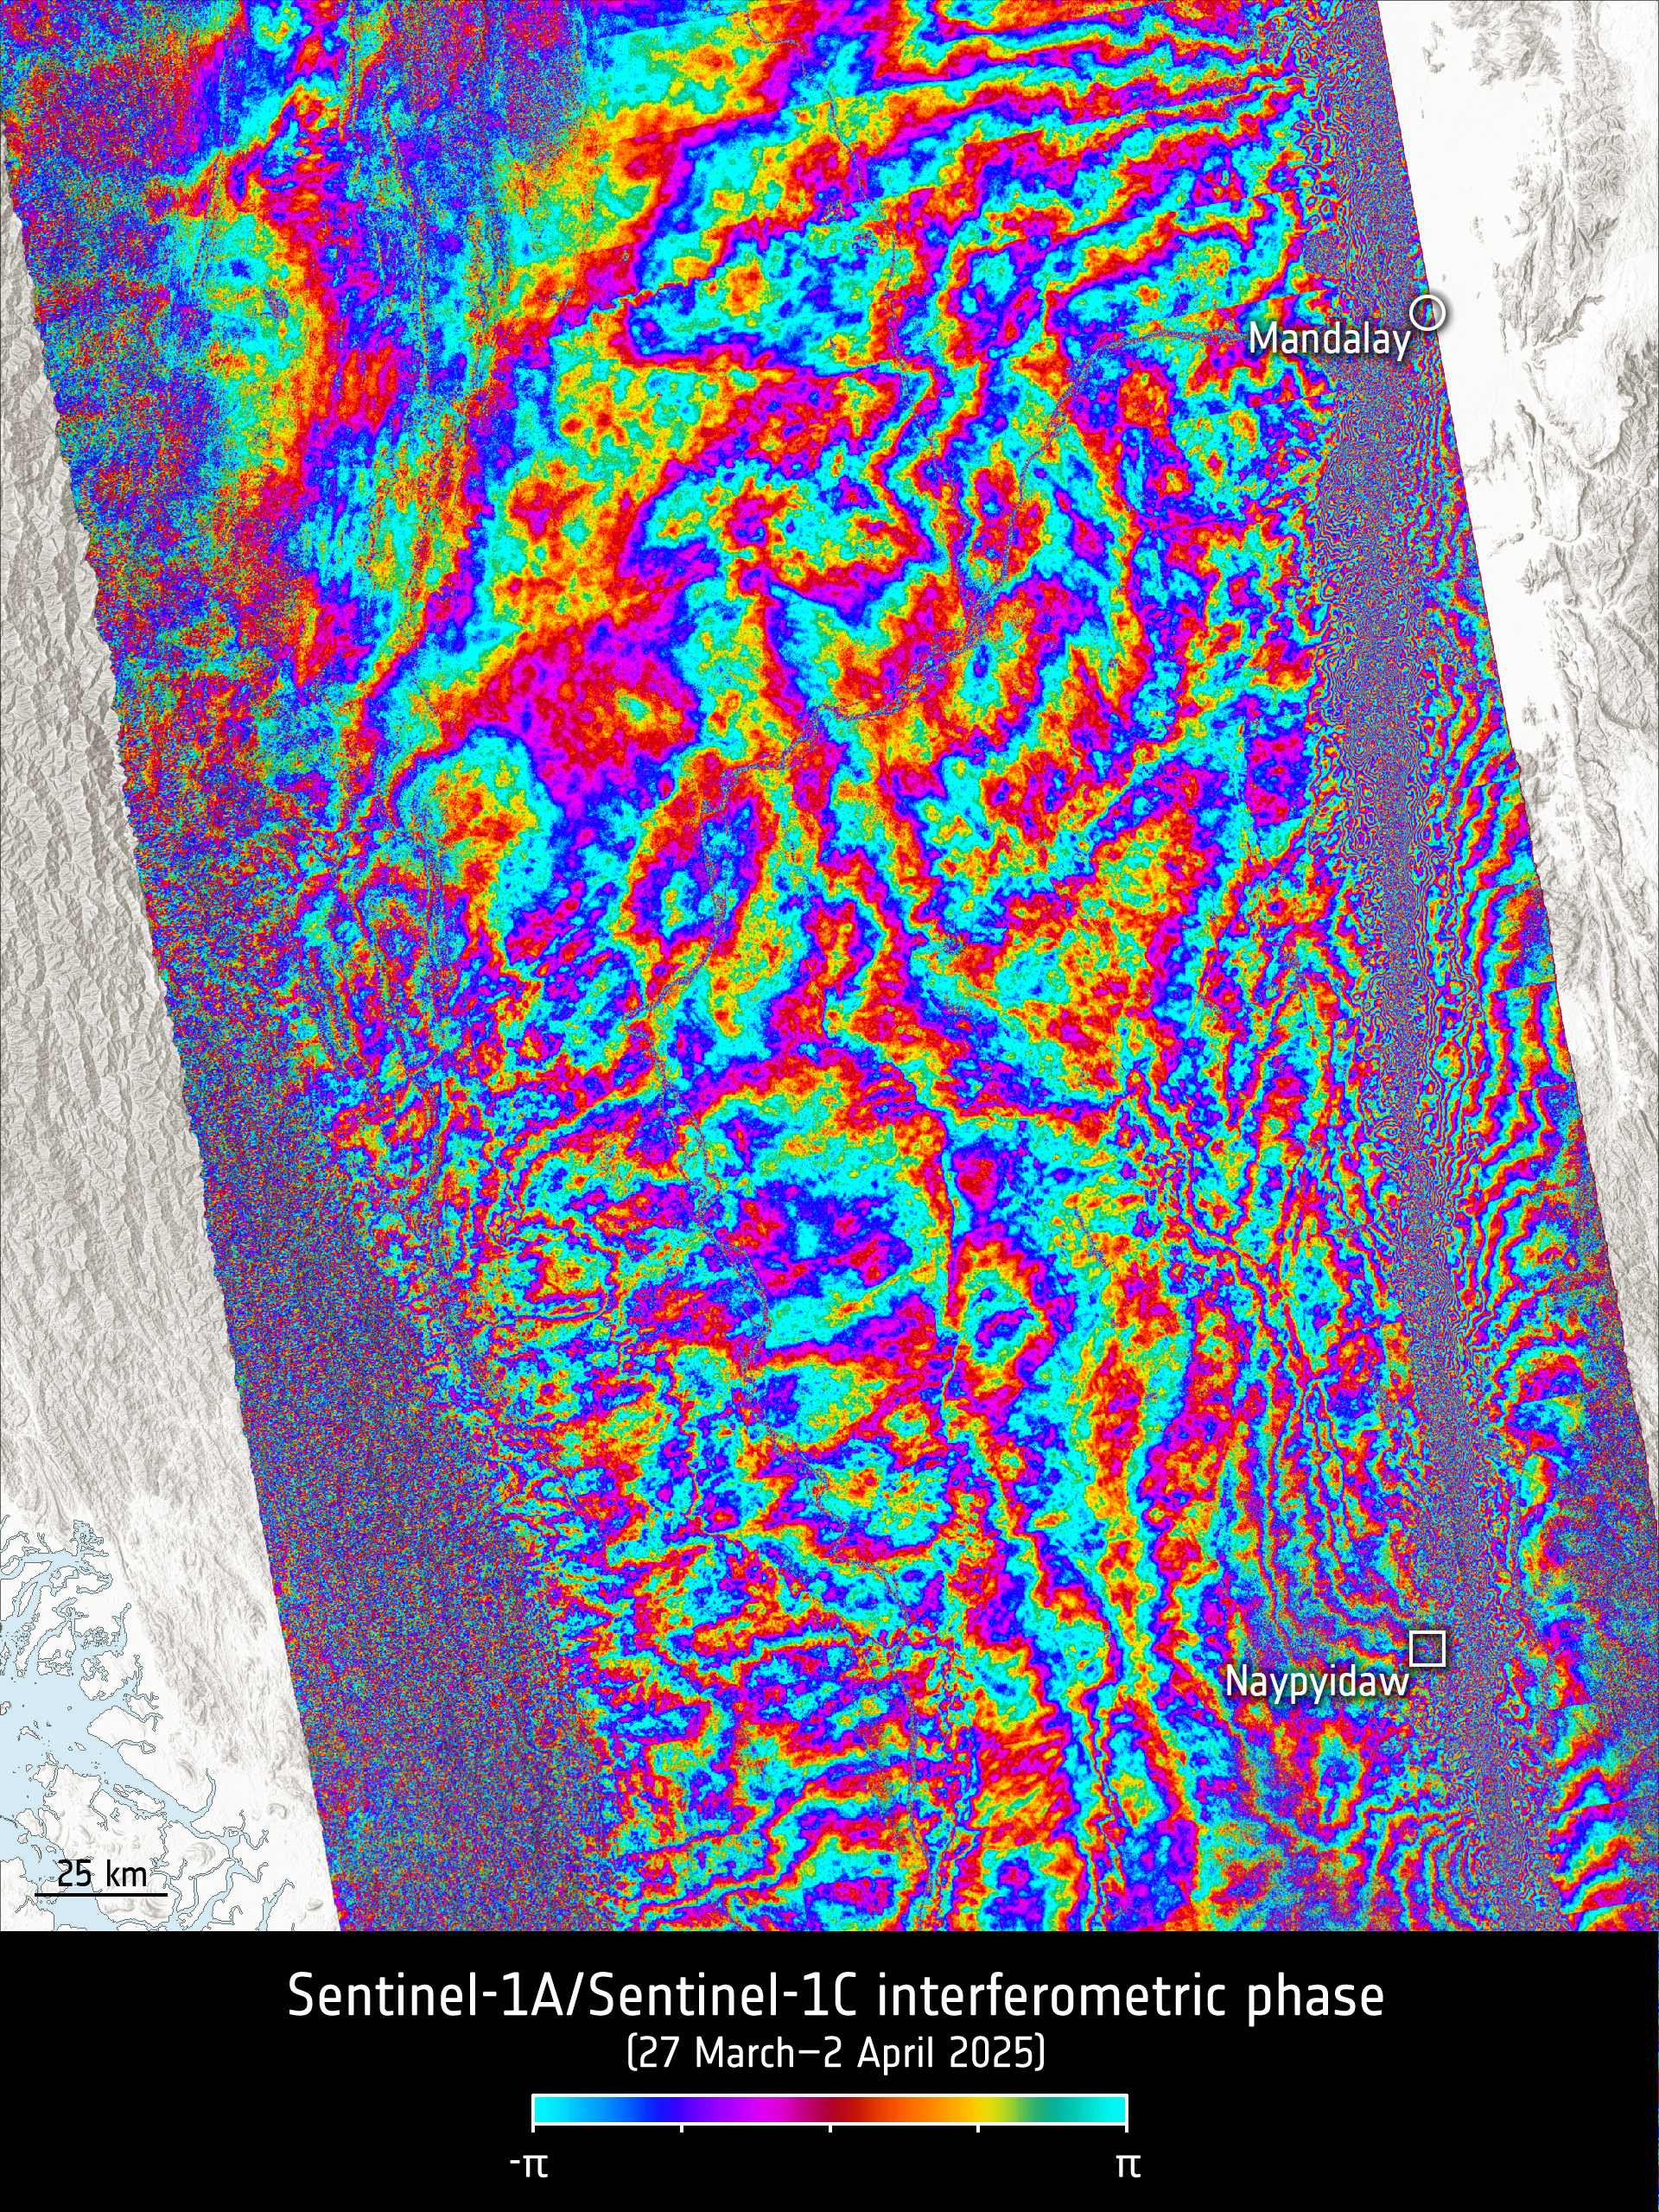
The earthquake rupture, which is the sudden break and movement along a fault, extended approximately 342 miles (550 kilometers) along the Sagaing Fault — one of the longest documented surface ruptures ever recorded for a strike-slip fault.
The interferogram revealed 63 inches (160 centimeters) of ground displacement along the fault line, indicating significant movement on either side of the fault. This data provides critical insight on the earthquake, which can aid in disaster response efforts.
"These data are a game-changer," Dirk Geudtner, ESA's Sentinel-1 System Manager, said in the statement. "They enable faster, more accurate assessments after disasters, and help us to improve earthquake models globally."