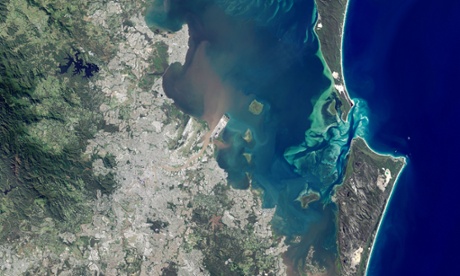
The east coast of Australia was hit by a severe storm and flooding on 1 May reports. South-east Queensland had14 inches of rain in three hours, causing flash floods that formed distinct river plumes along the coastline. Seen in the image above is a plume from the Brisbane river entering Moreton Bay.
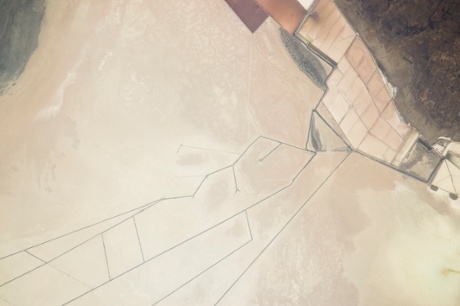
The Rann of Kutch, in western India, near Pakistan border, is a long, narrow salt flat that stretches inland for 200 miles from the Arabian Sea coast. Rann means desert in Hindi. The region is famous for its marshy salt flats. These inhospitable lowlands are resource-rich with minerals and natural gas deposits. Angular evaporation ponds along the floor of the Rann are the heart of a major salt-producing industry. The straight lines across the image are ditches that help control the flow of salt-rich water. The light-green tint (lower right) is shallow water from a small river that drains dark-toned farmland (top right). Thousands of years ago, the Rann was a shallow arm of the Arabian Sea. Land uplift caused by tectonic forces then closed off the connection with the sea, creating a vast lake that was still navigable during the time of Alexander the Great.
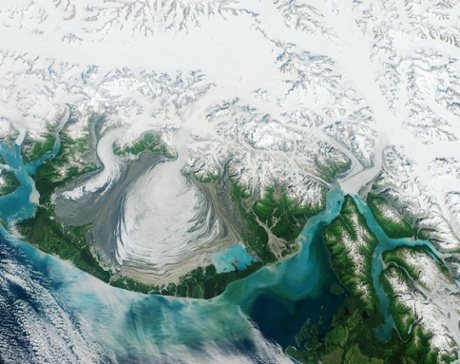
Since measurements began in 1895, Alaska’s Hubbard Glacier has been thickening and steadily advancing into Disenchantment Bay. The advance runs counter to so many thinning and retreating glaciers nearby in Alaska and around the world. According to Leigh Stearns, a glaciologist at the University of Kansas, Hubbard’s advance is due to its large accumulation area; the glacier’s catchment basin extends far into the Saint Elias Mountains. Snow that falls in the basin either melts or flows down to the terminus, causing Hubbard to steadily grow. In addition, Hubbard is building up a large moraine, shovelling sediment, rock, and other debris from Earth’s surface onto the glacier’s leading edge. The moraine at the front gives the glacier stability and allows it to advance more easily because the ice does not need to be as thick to stay grounded.
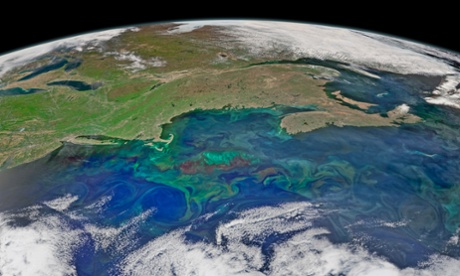
Springtime in the North Atlantic Ocean is a time of great change, turbulence, and productivity. Increasing sunlight, nutrient runoff from land and upwelling from the deep, and changeable atmospheric weather all conspire to colour the ocean surface with interesting patterns. The composite image above shows the north-west Atlantic Ocean on 14 May. Colours were enhanced to make the blooms more visible.
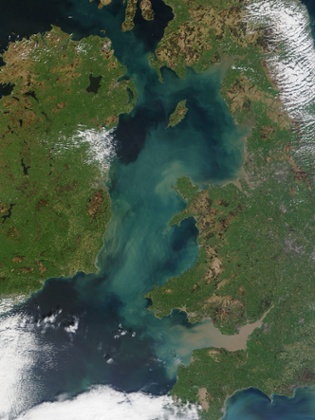
The Irish Sea sits between the islands of Ireland and Great Britain. It extends about 20,850sq miles and holds a volume of about 672 cubic miles. The Irish Sea is shallow, but it drains a large area: 4,386sq miles of Ireland and 13,320sq miles of the United Kingdom. The flow of water from Ireland (to the west) and England (to the east) brings large amounts of sediment into the Irish Sea, especially after heavy storms or during spring rains. An example of increased sediment caused by runoff can be seen in the south-east section of the image, where muddy sediment spills from the River Severn. But runoff is not the only source of sediment. The Irish Sea bottom is covered by a thick layer of mobile sediment of various types, from pebbles and cobbles to thick mud. The sediment in the eastern Irish Sea is particularly mobile and thick, giving rise to the name “the Mudbelt”.
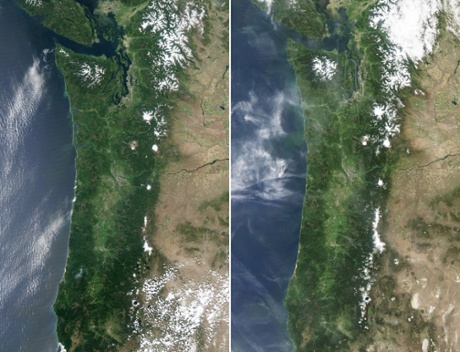
Concerns about drought are growing in the states of Oregon and Washington and the Cascade and Olympic Mountains. That’s because winter and early spring snows instead fell as rain. Like many parts of the western United States and Canada, the region depends on mountaintop snow as a sort of frozen reservoir that melts and fills streams and rivers through warmer, drier summer months. Warmer than usual temperatures on land and offshore in the North Pacific led to rainfall events even at high elevations.
The image (above, right) shows the region on 13 May 2014, while the other (above, left) was almost a year later on 3 May 2015. Last year was not necessarily good for snowpack, but it was substantially better than 2015.
According to state officials, snowpack in Washington was 16% of normal as of 15 May, and yearly runoff is predicted to be at its lowest in 64 years. Of 98 locations that are regularly monitored for snowpack, 66 were snow-free by mid-May. The state’s water managers noted that 48 of 62 watersheds were at or below 75% of water capacity, and record-low water levels have been recorded on the Stillaguamish, Snohomish, Skykomish, and Snoqualmie Rivers, among others. The data prompted US governor, Jay Inslee, to declare a statewide drought emergency.
In neighbouring Oregon, average snow pack stood at 11%, its lowest level since 1992. The peak of mountain snow cover in 2015 came anywhere from three to thirteen weeks before the normal peak in April. Snow cover in May ranged from zero in the Klamath Basin to 16% in north-eastern Oregon. Conservation managers noted that three quarters of the state’s snow monitoring stations reached their lowest April measurements on record.
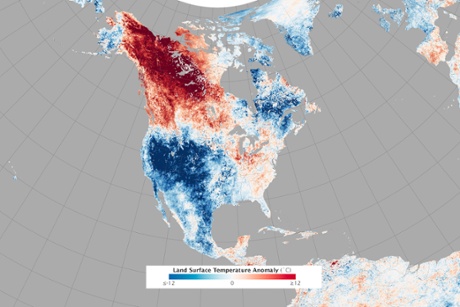
In the third week of May, it was warmer in Fairbanks, Alaska, than in Washington, DC. The small town of Eagle, Alaska, was hotter on 23 May than it has been on any day in Houston or Dallas this year. In what has become a frequent occurrence in the past few years, temperature profiles in North America appeared to be upside down.
The map above shows North American land surface temperatures from 17–24 May, 2015, compared to the 2001–2010 average for the same eight-day period. Shades of red depict areas that were hotter than the long-term average; areas in blue were below average for the week. White pixels were normal, and gray pixels did not have enough data, most likely due to excessive cloud cover.
This temperature anomaly map is based on data from the Moderate Resolution Imaging Spectroradiometer (Modis) on Nasa’s Terra satellite. Observed by satellites uniformly around the world, land surface temperatures (LSTs) are not the same as air temperatures. LSTs reflect the heating of the land surface by sunlight and they can sometimes be significantly hotter or cooler than air temperatures. (Read more about LSTs and air temperatures here.)
On 23 May, the air temperature at Fairbanks International airport reached 30C (86F), breaking the record of 26.7C (80F) from 2002. That same day, thermometers hit 32.8C (91F) in Eagle, marking the earliest 90F day in state history. The town had nine consecutive days above 80F. In Barrow, Alaska, on the shores of the Arctic Ocean, temperatures climbed to 8.3C (47F) on 21 May close to 10C (18F) above normal. Temperatures normally do not reach that high until mid-June.
To the south and east, at least 12 temperature records were set in Canada’s Yukon and Northwest Territories. Temperatures in Faro reached 27.4C (81.3F), 7.5C (14F) above the old record. With humidity levels between 10 and 20%, civil agencies warned of wildfire. At least 31 fires were reported in the Yukon alone as of 24 May.
According to several meteorologists, the unseasonable heatwave has been caused by a kinked jet stream that is sending air masses in a more north-south flow than the more typical east-west direction. The pattern of the jet stream may be related to atmospheric waves and circulation stirred up by the remnants of typhoons Noul and Dolphin.
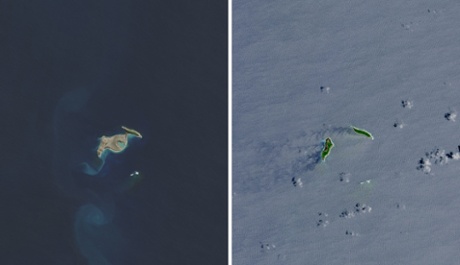
In December 2014, an undersea volcano exploded to life in the Polynesian island kingdom of Tonga. A month later, when the eruption had ceased and the ash cloud had cleared, experts began to get a better look at what the eruption had left behind – a new island.
The right-hand image shows the area on 2 December 2013, one year prior to the eruption. At that point, the small islands of Hunga Tonga (right) and Hunga Ha’apai (left) were separated by the South Pacific Ocean. The second image shows the same area on 28 April 2015, four months after the eruption—and the first time that Landsat got a cloud-free view.
According to a report in January from the Tongan Ministry of Information & Communications, the new island between Hunga Tonga and Hunga Ha’apai rose about 120 metres above sea level. It measured just 0.9 of a mile (1.5km) from north to south, and 1.2 miles (2km) from west to east. And while volcanic material connected the new island with Hunga Ha’apai to the west, it was a few hundred metres short of connecting with Hunga Tonga.
Already, the island has received visitors. The Australian Broadcasting Corporation ran a series of photographs taken by a group that explored the island in March 2015.
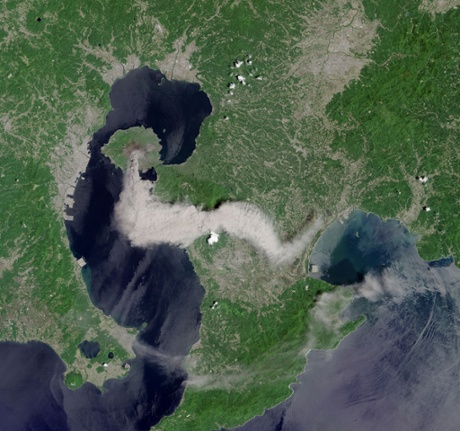
Sakura-jima volcano spewed a dense plume of ash over the Japanese island of Kyushu on 21 May 2015. Currently Japan’s most active volcano, Sakura-jima explodes several hundred times each year. These eruptions are usually small, but the larger eruptions can generate ash plumes that soar thousands of meters above the 1,040m summit. On 21 May 2015, a plume reached a height of 5,200m, according to the Tokyo Volcanic Ash Advisory Center.
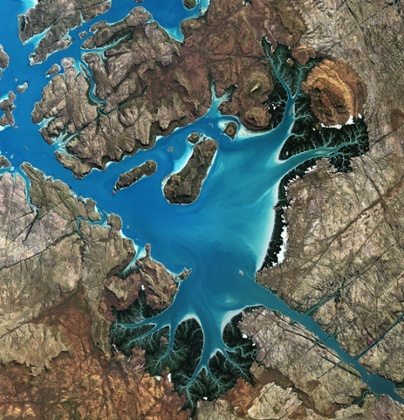
This satellite image over the Kimberley region of Australia captures the Saint George Basin along the country s northwestern coast. The basin is a deep harbour connected to the sea by a narrow strait. It is bounded by steep cliffs with large expanses of tidal mud flats and mangroves. The Prince Regent River flows into the basin from the lower-right corner, and the land north of this river is part of the Prince Regent National Park a Uunesco Biosphere Reserve. The Aboriginal Worora people are the traditional owners of this area, which is one of Australia s most remote. It is mainly accessed by air or boat, since there are no roads.
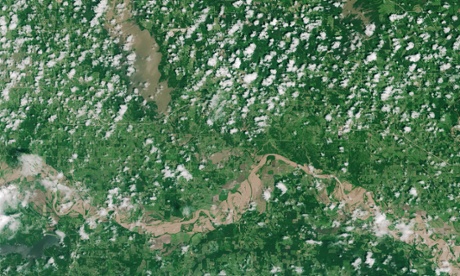
This natural-colour image above of flooding along the Red River was taken on 26 May 2015, an area that forms part of the state border between Texas and Oklahoma.
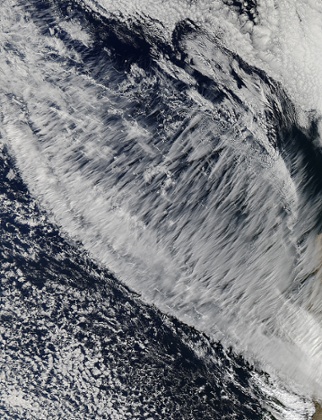
What are those strange filament-like clouds fanning out over the Pacific Ocean? Scientists agree that they are high-altitude cirrus clouds. But which type of cirrus is less clear. On 21 May 2015 satellite acquired this natural-colour image of cirrus clouds that formed off the coast of Chile. They are relatively thin and wispy and run diagonally across the image.
According to Nasa atmospheric scientist Patrick Minnis, the clouds likely formed at high altitudes along the jet stream. Relatively moist, lower-level air is pulled into the upper layers, where it then cools and forms cirrus ice crystals. The cirrus then spread out and form the diverging plumes visible throughout most of the image. The cloud tops reach up to about 8 miles (13km) and the winds are well over 100 miles per hour, Minnis said.
A false-color view of the same scene supports the idea that the clouds are cirrus. In that temperature map, the clouds are dark purple, which means they are cold—likely containing ice crystals—and reside high in the atmosphere.
Nasa scientist Ann Fridlind noted: “These cirrus clouds could be a dense configuration of the classic mares’ tails formation,” which fan out into a shape that resembles horses’ tails. In this case the spread could be caused by clear-air turbulence or by wind shear.
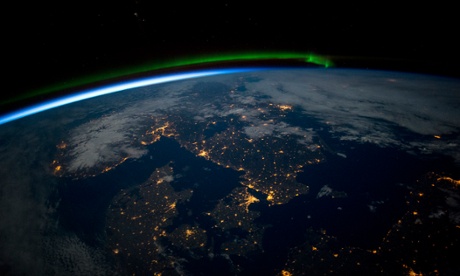
This photograph of southern Scandinavia was taken just before midnight on 3 April 015. Prominent features include a green aurora to the north, the blackness of the Baltic Sea (lower right), and clouds (top right) and snow (in Norway) illuminated by the full Moon.
City lights clearly show the coastline of the Skagerrak and Kattegat seaway that separates Denmark from its neighbours to the north and leads into the Baltic Sea. The largest light clusters on the seaway are the capital cities of Oslo and Copenhagen. Cities facing the Baltic are the Polish port of Gdansk and the Swedish capital, Stockholm. Smaller cities in northern Germany also trace the Baltic coastline (lower right).
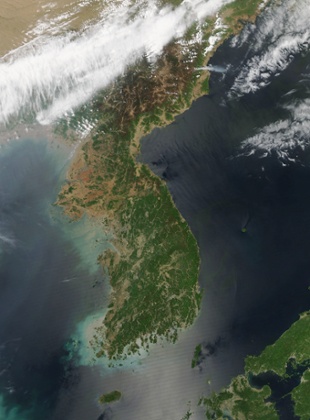
This Korean Peninsula photograph was taken on 5 May 2015. Fields and grasslands, found mainly in coastal plains, appear light brown. Forests appear green, although at the highest elevations some forests have a brown tint as they are just beginning to green up at in mid-spring. A large bank of white clouds lies over the border between North Korea and China. Red hotspots mark actively burning fires. Gray smoke billows from many of the fires, particularly in eastern North Korea. Most of the hotspots cluster in North Korea, with only a few located in South Korea.
Satellites often detect fires in North Korea in April and early May. As snow retreats in the spring, many farmers use fire to clear away last year’s crop debris and to fertilize the soil for the coming season. Such fires generally remain small and produce only modest amounts of smoke. But at times the fires can get out of control, and become wildfires. Several fires in eastern North Korea appear to be very large, with large amounts of smoke extending over the Sea of Japan.
North Korea faced a serious drought in the summer of 2014. While reasonably warm and wet weather was a late-season boon to crops in November, a dry winter followed. Dried out forests have raised concerns about potential food shortages in the spring.
The Mekong River (right) and Tonlé Sap River (left) is shown with the centre of this image about 20 miles (30km) north of the centre of the Cambodia’s capital, Phnom Penh. Originating on the Tibetan Plateau and passing through six countries before emptying into the South China Sea, the 2702-mile (4350km) Mekong is the single largest source of protein for communities in its basin. Tens of millions of people rely on the river for fishing, while agriculture is intensive along parts its course.
The Tonlé Sap changes flow direction seasonally. During the dry season from November to May it flows south, draining into the Mekong at Phnom Penh. The direction changes during the wet season, causing a rise in water levels in the surrounding floodplains.
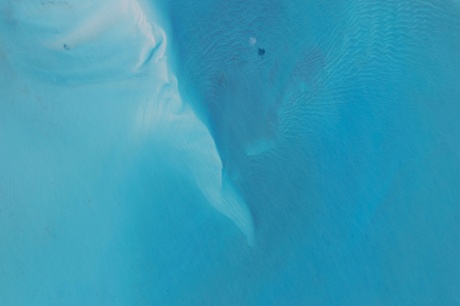
Nasa astronaut Scott Kelly tweeted this aquamarine seascape Earth observation, above on 10 May 2015 from the International Space Station.