More than 7.8 million people voted “yes” to same-sex marriage (61.6% of clear responses) beating the 4.9 million “no” voters (38.4% of responses). But New South Wales had the lowest “yes” vote as a result of western Sydney electorates with high immigrant populations voting against.
A total of just over 12.7 million (79.5% of the electorate) participated in the survey overall.
The ACT led the “yes” vote with 74%, followed by Victoria (64.9%), Western Australia (63.7%), Tasmania (63.6%), South Australia (62.5%), Queensland (60.7%), the NT (60.6%) and lastly New South Wales (57.8%).
The seven highest “no” votes by electorate were all in western Sydney, with “no” winning at least 59% in all seven of these electorates. “No” won 74% in Blaxland, 70% in Watson, 65% in McMahon, 64% in Werriwa, 64% in Fowler, 62% in Parramatta and 59% in Chifley. However, “yes” won 75% in major “no” supporter Tony Abbott’s Warringah.
These seven strongest “no” electorates in Western Sydney also all voted Labor by large margins in the 2016 federal election.
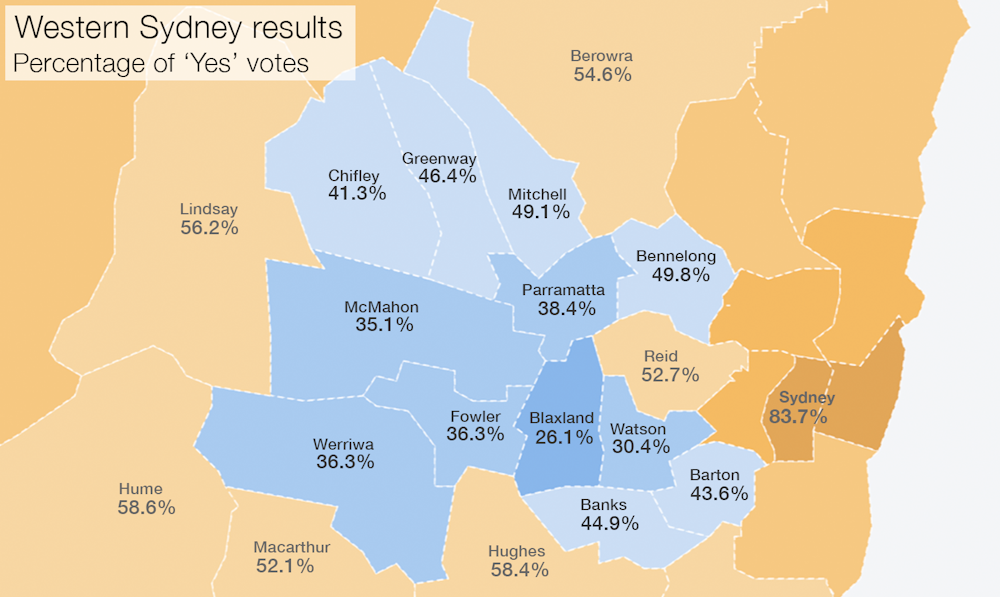
Overall, 133 of the 150 federal electorates voted “yes”, and 17 “no”, with Blaxland the highest “no” electorate (74%). 12 NSW electorates, three Queensland electorates and two Victorian electorates voted “no”.
The closest result was in Bennelong, the seat where a byelection will be held on December 16, where “no” had the most votes by 50.2% to 49.8%. The highest “yes” votes were in the electorates of Melbourne and Sydney (both 84%).
Turnout was slightly higher among women (81.6%) than men (77.3%). The youngest eligible voters (18-19-year-olds) participated strongly with a 78.2% turnout, more than for any other age group below 45.
If we divide the number of “yes” and “no” responses by the total electorate (just over 16 million), then 48.8% of the overall electorate voted “yes” and 30.5% “no”. While “yes” did not quite win a majority of the overall electorate, this is a very strong result considering the voluntary voting in this survey.
Polling in the lead up to the survey results always suggested an easy “yes” victory, and this has been shown to be accurate. Yesterday, Newspoll gave “yes” a 63-to-37 lead, so “no” performed a little better than expected, but there was no major error.
A tweet from pollster ReachTEL mocked a Griffith University study that expected “no” to win narrowly.
While “yes” won the plebiscite easily, parliament still has to legislate same-sex marriage. Hard-right MPs want protections for religious freedoms, and so the debate over the bill that will be passed could be divisive.
However, given the large “yes” victory, I expect a bill to be passed in the final two weeks before parliament adjourns for the Christmas break.
Adrian Beaumont does not work for, consult, own shares in or receive funding from any company or organization that would benefit from this article, and has disclosed no relevant affiliations beyond their academic appointment.
This article was originally published on The Conversation. Read the original article.