As an investor, you can prepare for the upcoming Q4 stock market rally by identifying potential tailwinds, assessing the market's current volatility, considering different investing styles, and identifying sectors with growth potential and seasonality. Historically, the fourth quarter has often been a strong period for the stock market, driven by holiday spending and end-of-year optimism.
Identify Potential Catalysts
Positive drivers in the market can create tailwinds for a rally. These factors include:
- Continued momentum from AI: The AI boom has fueled growth and is expected to persist, supporting demand and productivity improvements. However, some warn about potential "bubble-like" tendencies and stretched valuations in the most hyped AI stocks.
- Anticipated Federal Reserve rate cuts: The Federal Reserve is expected to continue cutting rates, which would help maintain growth and lower borrowing costs.
- Strong corporate earnings growth: Continued strength in company earnings can drive overall market performance.
Assess the Current Market and Risks
The current market environment poses both opportunities and risks. Before making any moves, consider:
- Elevated valuations: With the market trading at a premium, there is less room for error. A minor disappointment could lead to a volatile reaction.
- Increased volatility: Historically, volatility can increase during Q4, often around earnings season. While this can present opportunities, it also requires risk management skills.
- Ongoing macroeconomic concerns: Include slowing consumption, geopolitical threats, and inflation pressures from new tariffs. The fears of stagflation are being discussed among market participants. Slower economic growth could temper market enthusiasm.
Evaluate Investing Strategies
Investors will approach the Q4 market differently, depending on their risk tolerance.
- For growth-oriented investors: Monitor stocks with strong earnings momentum, particularly those involved in AI and other high-growth sectors. Watch for potential breakouts and manage risk closely.
- For value-oriented investors: In a market with elevated valuations, look for undervalued stocks with higher dividend yields. These can provide a source of return and some protection in a downturn.
- For defensive investors: If you are concerned about volatility, consider reallocating some capital to traditionally defensive sectors, such as consumer staples, healthcare, and utilities, with less sensitivity to economic shifts. However, some defensive sectors, like utilities, have significantly increased valuations.
Review Specific Market Segments
The Q4 rally will likely affect different market parts in various ways.
- Small-cap stocks: Small-cap stocks may offer an attractive entry point. According to Morningstar, they are trading at a discount relative to fair value estimates and could benefit from future rate cuts.
- Consumer discretionary: This sector often gets a boost from the holiday shopping season, making it a focus for late-year activity.
- Financials: The financial sector could see a boost if long-term bond yields rise, creating a steeper yield curve.
- Mega-cap tech: The handful of tech giants that have driven much of the market's gains are seeing high valuations. While their gains may continue, caution is warranted due to their high prices.
Technical Picture
What can you say? The bull market lives from the April 2025 lows. I could develop stories like a Fibonacci 4.618 extension is above the current price and will reverse the trend. Or there is some 15-minute resistance level to the left of the chart that will halt the uptrend. Then we could add a series of what-ifs: it might, it feels overbought, or Saturn is in alignment with Pluto, which will cause the bull market to end. These statements are plastered all over the internet. Could any of them actually happen? Of course! But let's face it, more money is made by trading what you see than you think.
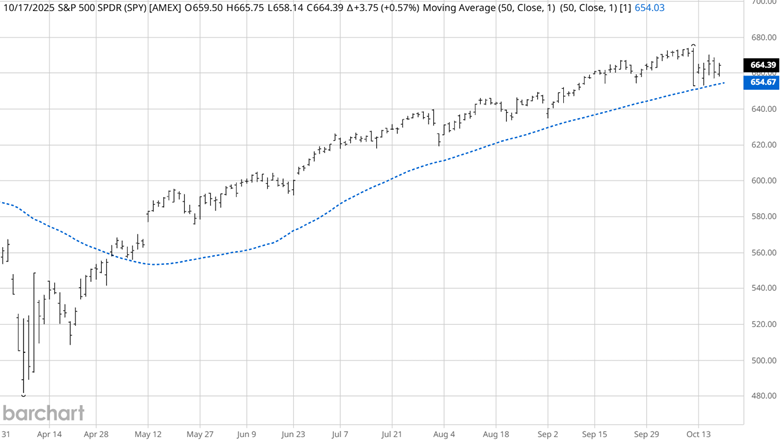
Source: Barchart
The ETF SPY has recently been testing its up-sloping 50-day simple moving average (SMA). While this is not a buy signal, it clearly states that the most straightforward path of least resistance is up.
Seasonal Patterns
Investors often overlook seasonal patterns as a timing tool to assist in managing their portfolios.
Long-Term Investors: Optimize Portfolio Growth
- Buy Low: Use seasonal lows, like stock indices weakness in September or October, to average down and reduce cost basis.
- Strategic Rebalancing: Schedule portfolio rebalancing during weak seasonal periods to buy low and sell high across assets.
- Informed Allocations: Increase stock indices allocations ahead of historically strong periods in the fall for deliberate long-term growth.
Stock investors should know the historical seasonal buying patterns in the year's 1st and 4th quarters.
Moore Research Center, Inc. (MRCI) researches markets to find consistent seasonal patterns with relatively low drawdown periods. Q4 has historically seen significant stock index buying. MRC refines that 15-year data to create a more detailed seasonal window with statistics to support their findings.
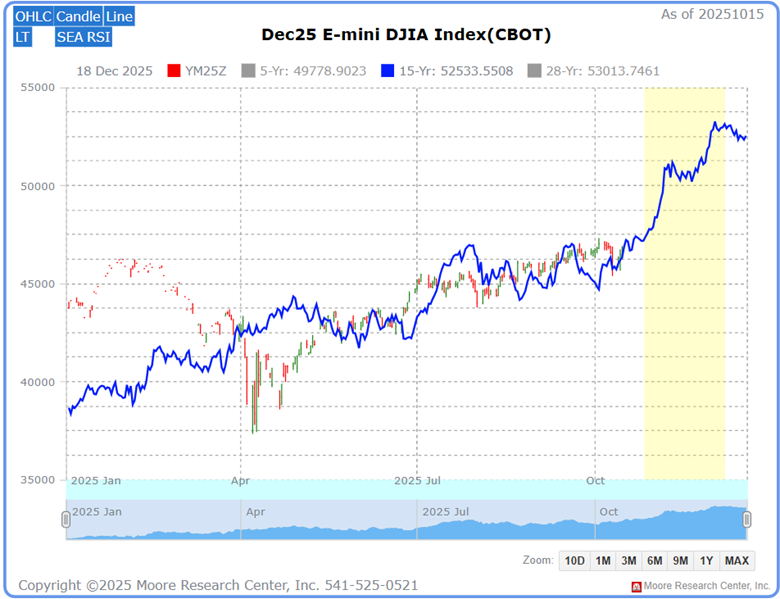
Source: MRCI
The Dow, Nasdaq, and S&P 500 stock indexes are highly correlated. The other indices are also impacted when one has a strong seasonal pattern. The current seasonal pattern research shows a perfect record for the past 15 years. MRCI has found that the Dow Jones has closed higher on approximately December 07 than on October 27 for 15 of the past 15 years, a 100% occurrence rate. Two of those years did not have a daily closing drawdown. During the hypothetical backtesting, the average win was 1,063 points or $5,312 per contract.
As a crucial reminder, while seasonal patterns can provide valuable insights, they should not be the basis for trading decisions. Traders must consider various technical and fundamental indicators, risk management strategies, and market conditions to make informed and balanced trading decisions.
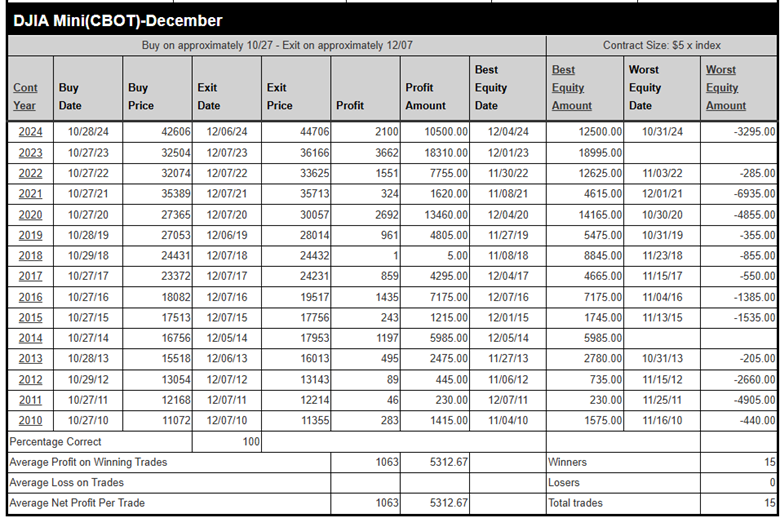
Source: MRCI
S&P 500 Correlation to Prior Years
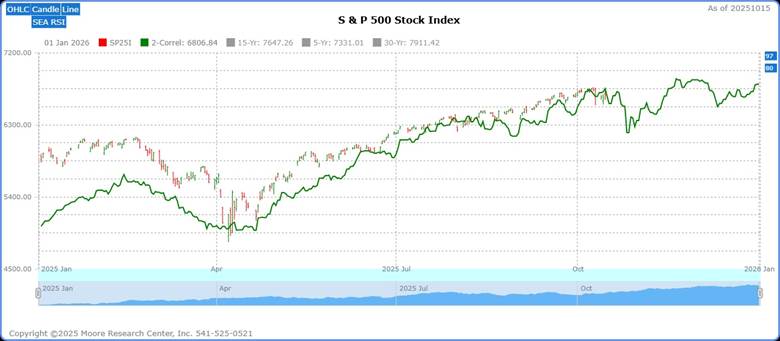
Source: MRCI
Another tailwind for the upcoming seasonal pattern is market correlation. The December S&P 500 futures follow the same pattern as in 1980 and 1997 (green line). The current market pullback appears to be in alignment with this correlation. Stock indices typically have a volatile early fall period. The correlation aligns well with the October 27 seasonal buy window, as the pullback generally has ended. Keep an eye on the uptrend and proceed cautiously if the trend turns sideways or down.
Assets to Trade Stock Indices
During the upcoming seasonal buy window, when stock indices historically perform strongly, investors can effectively utilize various assets to trade stock indices. Exchange-traded funds (ETFs) like the SPDR S&P 500 ETF (SPY) or the Invesco QQQ Trust (QQQ) offer broad exposure to major indices such as the S&P 500 and Nasdaq-100, providing diversified access with low fees. Index futures, such as E-mini S&P 500 (ES), Nasdaq 100 (NQ), or the Dow Jones (YM) futures, allow for leveraged trading with high liquidity, which is suitable for more experienced investors. Options on indices or ETFs, like SPY options, enable strategies ranging from bullish calls to protective puts, offering flexibility to capitalize on market movements.
In Closing…
The fourth quarter presents a compelling opportunity for investors to capitalize on historical seasonal strength in stock indices, driven by catalysts like AI momentum, anticipated Federal Reserve rate cuts, and robust corporate earnings. Armed with knowledge of potential tailwinds, market risks, and strategic approaches—whether growth, value, or defensive—you're equipped to navigate this dynamic period. Assets like ETFs (SPY, QQQ), index futures, and options provide versatile tools to seize this window, while small-cap, consumer discretionary, and financial sectors offer targeted growth potential. Historical data, such as the Dow's perfect 15-year track record of closing higher from late October to early December, underscores the opportunity. Will you act on this seasonal edge, using disciplined risk management and technical insights, or let the market's upward momentum pass you by? The challenge is yours—trade what you see, not what you think.