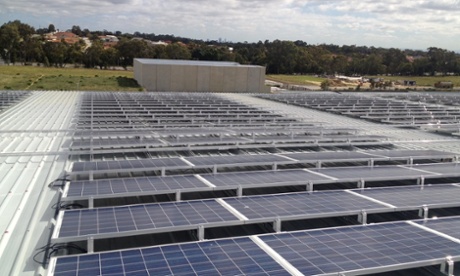
New South Wales and Victoria are ‘going backwards on renewable energy’, according to the latest report from the Climate Council.
Within the report are detailed statistics on emissions, renewable energy production and investment for each state and territory in Australia. So how do the states match up?
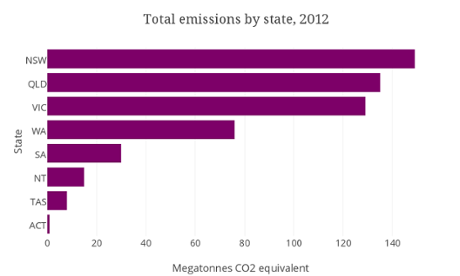
On emissions, it’s not surprising to find the states with a higher population lead the way.
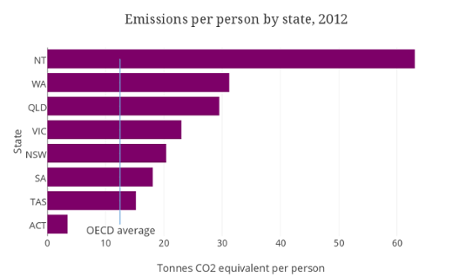
When population is taken into account, the Northern Territory and Western Australia rank at the top. This is probably due to mining activity and their remoteness. All states and territories except the ACT are above the OECD average of 12.47 tonnes of CO2 equivalent per person, though it’s worth pointing out that the ACT is reliant on other states for its electricity.
According to the Clean Energy Council, 14.76% of Australia’s electricity in 2013 came from renewable sources. The states with the highest emissions – NSW, Queensland and Victoria – have far higher ratios of fossil fuel to renewable energy production:
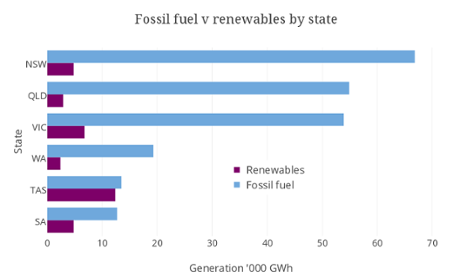
The state with the highest ratio of renewable energy to fossil fuel energy was Tasmania because of a large increase in hydro power in 2013.
South Australia also had a large proportion of renewable energy in the mix, and is now one of the leading states in terms of renewable energy capacity per person. The Climate Council report analysed renewable energy projects since 2001, and put South Australia on top:
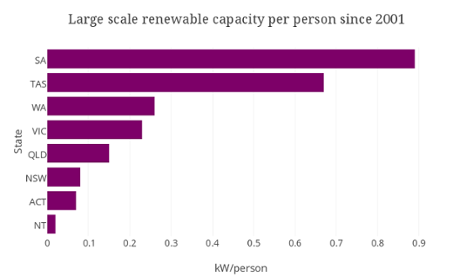
The capacity figure includes some projects under construction but not yet producing power, and is based on data from the Clean Energy Regulator.
NSW, despite having the highest total emissions, has not significantly increased its investment in renewables since 2001. It is, however, still the state with the highest total installed renewable capacity (although this wasn’t reflected in the 2013 production figures above).
South Australia’s high ratio is due to a large increase in solar photovoltaic (PV) systems. It is now the state with the highest percentage of homes with solar PV systems installed:
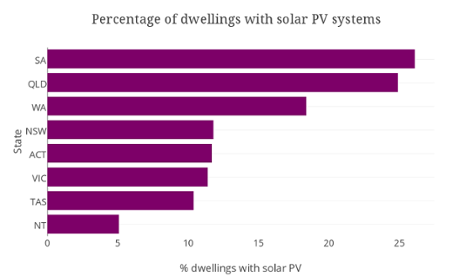
According to the Climate Council report, this increase is being encouraged by state-based policies, including a target for 50% of electricity to be produced from renewables by 2025.