Shares of Procter & Gamble (PG) are rallying on Wednesday, up about 3.5% after the consumer-products powerhouse reported better-than-expected earnings.
Of course, it helped that the Cincinnati company said it could see a pricing power boost going forward.
A 3.5% gain isn’t quite like the monster rally we’re seeing in SoFi Technologies (SOFI), which is up 18%, but it’s pretty good for a stock that isn’t known to have much movement.
Further, the overall market remains a dicey proposition for traders, so some stability in P&G is a welcome change for the bulls.
Let’s also not forget just how strong this stock has been lately.
While the shares were down in the two prior weeks coming into this week, Procter & Gamble stock had ripped off 10 straight weekly gains before that.
That’s a pretty powerful rally. Now let’s see whether the stock can continue higher and keep acting as a beacon of strength for the bulls.
Trading P&G Stock
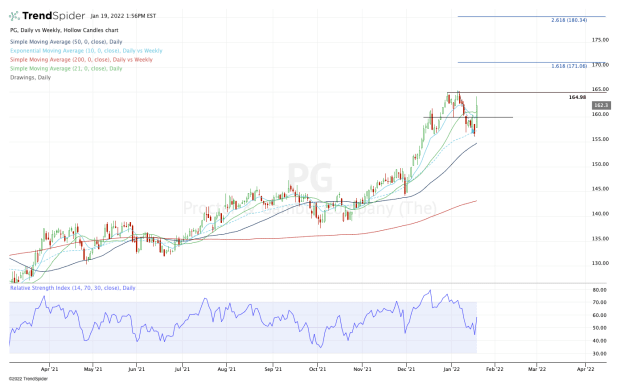
Chart courtesy of TrendSpider.com
Yesterday, I detailed a low-risk buy setup in P&G stock. However, it was a low-risk setup in that the levels made sense from a risk/reward perspective.
However, it did not account for earnings in the following session. That type of binary event is always a risk.
In any regard, I was calling out the test of the 10-week moving average. That was significant to me because it has been almost two months since the stock tested this mark.
Plus it had been a relative-strength leader until the past few weeks.
With the stock bouncing now, the bulls must be careful that this one doesn’t roll back. Specifically, keep an eye on the $160 level.
Not only has this level proved notable -- as both resistance and support -- over the past few weeks, but a break below this mark puts P&G stock back below the 10-day and 21-day moving averages.
A close below all these marks opens the door to this week’s low near $156, as well as the 10-week moving average. Below both measures and the 50-day moving average is in play.
On the upside, keep an eye on $165. This level has been resistance so far this month and last month. A breakout over $165 opens the door to $171. Above that could put $180 in play.