Plug Power Inc (NASDAQ:PLUG) gapped up 6.5% to start the trading day on Tuesday, retraced down to almost completely fill the gap and then popped up over its opening price.
The move higher is the first indication Plug is reversing course into an uptrend, after trading in a downtrend between April 4 and Monday, where the stock found a bottom at the $24.72 mark.
An uptrend occurs when a stock consistently makes a series of higher highs and higher lows on the chart.
The higher highs indicate the bulls are in control, while the intermittent higher lows indicate consolidation periods. Traders can use moving averages to help identify an uptrend, with rising shorter timeframe moving averages (such as the eight-day or 21-day exponential moving averages) indicating the stock is in a steep shorter-term uptrend and rising longer-term moving averages (such as the 200-day simple moving average) indicating a long-term uptrend.
A stock often signals when the higher high is in by printing a reversal candlestick such as a doji, bearish engulfing or hanging man candlestick. Likewise, the higher low could be signaled when a doji, morning star or hammer candlestick is printed. Moreover, the higher highs and higher lows often take place at resistance and support levels.
In an uptrend the "trend is your friend" until it’s not, and in an uptrend there are ways for both bullish and bearish traders to participate in the stock:
- Bullish traders who are already holding a position in a stock can feel confident the uptrend will continue unless the stock makes a lower low. Traders looking to take a position in a stock trading in an uptrend can usually find the safest entry on the higher low.
- Bearish traders can enter the trade on the higher high and exit on the pullback. These traders can also enter when the uptrend breaks and the stock makes a lower low, indicating a reversal into a downtrend may be in the cards.
Want direct analysis? Find me in the BZ Pro lounge! Click here for a free trial.
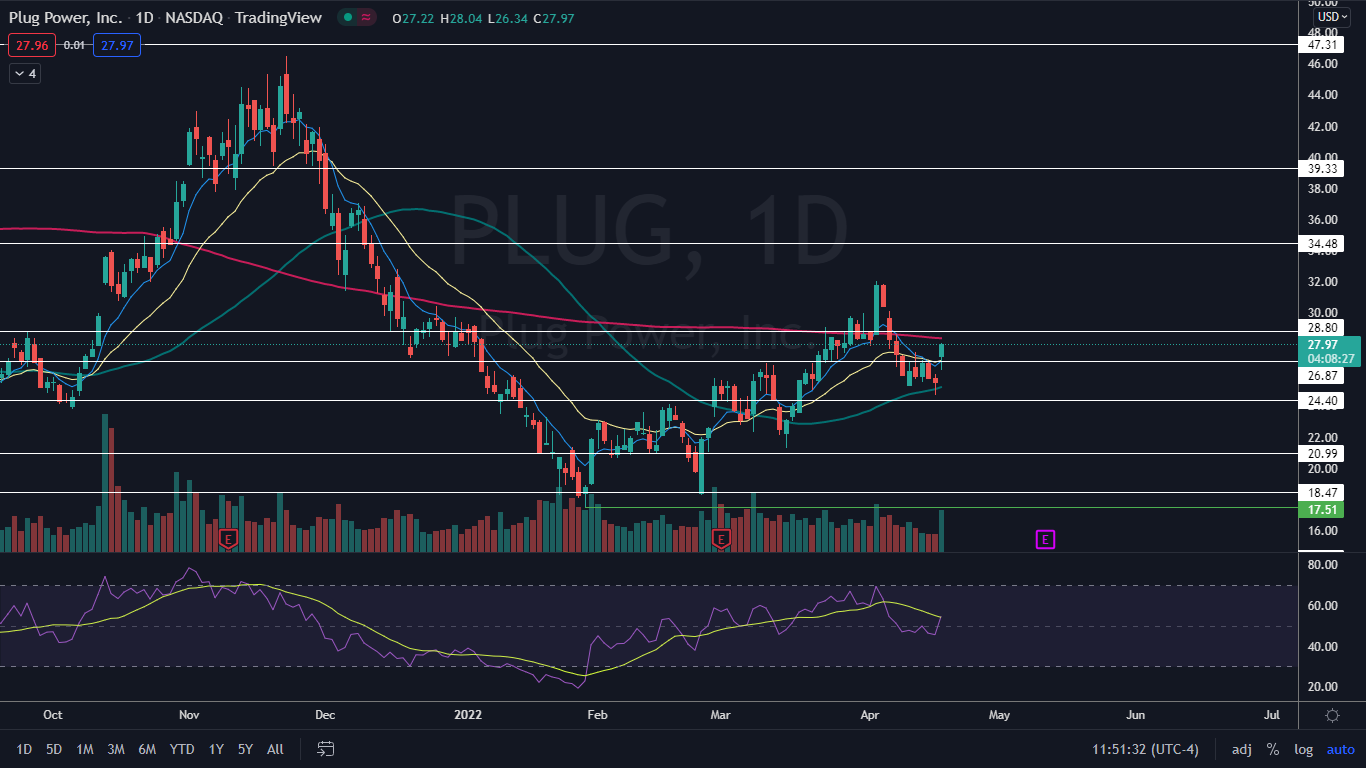
The Plug Chart: On Monday, Plug printed a hammer candlestick on the daily chart, which indicated a reversal to the upside was likely. The reversal was strong enough to cause Plug to print a high above the most recent lower high, which was printed at the $27.46 level on April 12.
- If Plug continued to trend higher on Tuesday, the eight-day exponential moving average (EMA) will cross above the 21-day, both of which Plug regained as support. If that happens, Plug may have enough power to regain the 200-day simple moving average as support, which would indicate the long-term sentiment in the stock has become bullish.
- On Tuesday, Plug was trading on higher-than-average volume, which indicates a high level of interest has returned to the stock. At press time, about 21 million shares of Plug had exchanged hands, compared to the 10-day average of 16.91 million.
- If Plug Power closes the trading day near its high-of-day price, it will print a second consecutive hammer candlestick, which could indicate higher prices will come again on Wednesday. If the stock closes the trading day flat or toward the low-of-day, it will print a doji or inverted hammer candlestick, which could indicate lower prices are in the cards and traders can watch to see if the stock prints a higher low above Monday’s low-of-day.
- Plug has resistance above at $28.80 and $34.48 and support below at $26.87 and $24.40.
See Also: Why Plug Power Shares Are Surging