This article is part of Verducci’s View, a new weekly baseball newsletter from Sports Illustrated senior writer Tom Verducci. Every Monday, Tom empties out his notebook over email and covers MLB’s hottest topics, provides in-depth analysis through both text and video breakdowns, looks forward to what’s worth watching during the week and more. If you want to be featured in his new mailbag, please email newsletters@si.com with any questions about MLB or his decades in the sport.
The frenzy at the trade deadline to find starting pitching was years in the making. Major league teams have been developing starters to be the equivalent of sprinters, not middle-distance runners. The craft of pitching has devolved into a brutally physical task in which burst effort has replaced modulated effort.
From pitch No. 1, the mission for starters is to throw as hard and as nasty as they can to get swings and misses, leave the game early and require more days of rest to recover.
Sure, this trend is familiar. But we have grown so inured to this decline that we miss just how low starting pitcher workload continues to sink. Last month, for instance, complete games in July hit an all-time low for the month: 2 (by Dylan Cease and Yoshinobu Yamamoto).
It marked only the fourth time in any full month with such a low total of complete games—three of which have occurred in the past six months.
Fewest CG in a Full Month
| Month | Complete Games | Games Started |
|---|---|---|
| August 2025 | 1 | 842 |
| March/April 2022 | 1 | 634 |
| March/April 2026 | 2 | 936 |
| July 2026 | 2 | 742 |
The pace of deterioration is accelerating. For examples:
- Starters averaged 5.03 innings in July, the fewest ever in a given month.
- The starters-relievers workload split this year is 57%-43%. Fifteen years ago, it was 65%-35%.
- No pitcher has thrown more than 120 pitches in a game since Justin Verlander on Aug. 31, 2025. In 2011 there were 100 such games.
- The unofficial, arbitrary upper limit of pitches has dropped from 120 to 110. There have been only 13 starts this season in which a pitcher threw 110 pitches—four of them by Cease. No one else has even two 110-pitch games.
Here is a visual of how fast and how far the limits on pitching have been pulled back. You don’t have to go back a generation or two. Here is how much starting pitching has changed in only 15 years, or just since Nathan Eovaldi debuted:
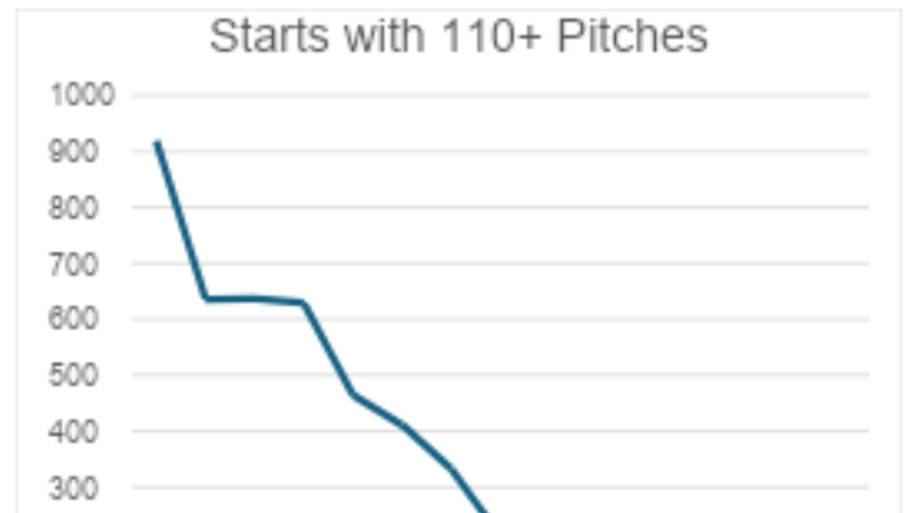
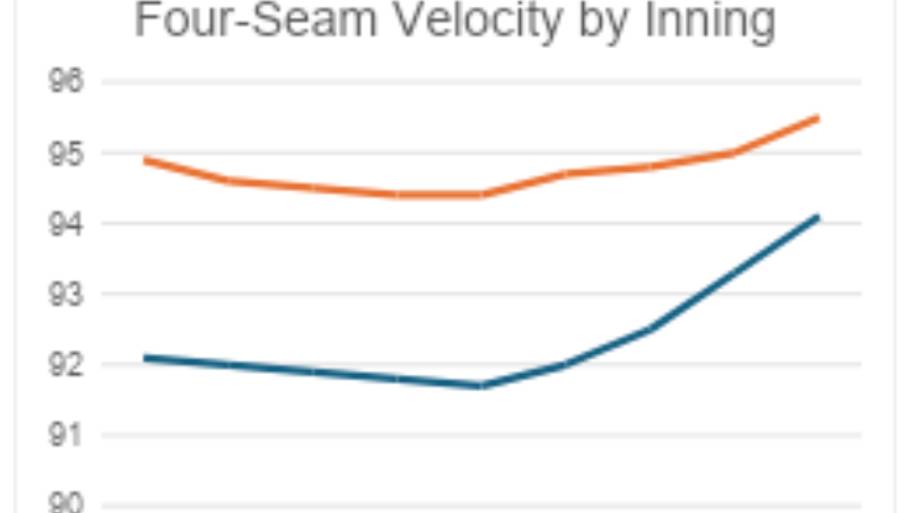
Heck, I wouldn’t get on a roller coaster with that precipitous of a dip. The end of velocity modulation is evident in this next chart. It shows the average four-seam velocity by inning 15 years apart. It’s scary enough to think the velocity in the first inning today is higher than what it was in the ninth inning in 2011. Think of it as starters bringing traditional closers’ stuff to the mound.
But the key takeaway from the shape of the lines is the rapid death of modulation. The blue line (2011) curves more. The orange line (2026) is flatter.
In 2011, the average velocity difference between the first (92.1 mph) and ninth (94.1) innings was 2.0 mph, or 2.2%. In 2016, the delta from first (94.9) to ninth (95.5) is just 0.6 mph, or 0.06%. Pitching is on blast from start to finish.