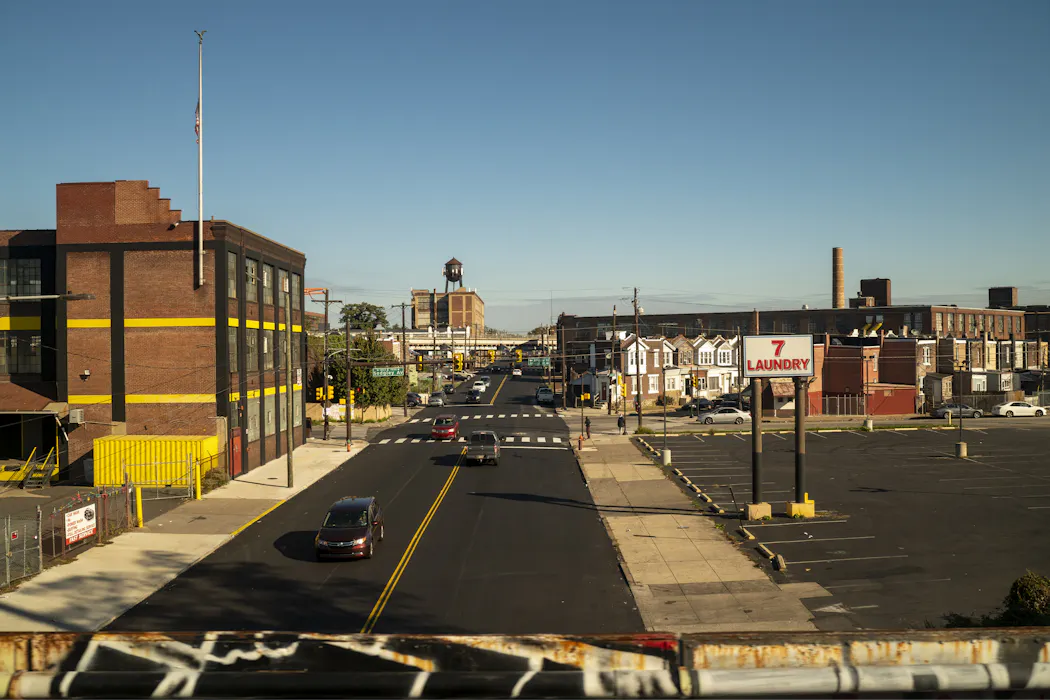
Philadelphians who live near industrial land and major roads – those who live in the Port Richmond and Bridesburg neighborhoods along I-95, or the Delaware River port-industrial corridor, for example – face worse air pollution and are more likely to have asthma than residents who live farther from those sites.
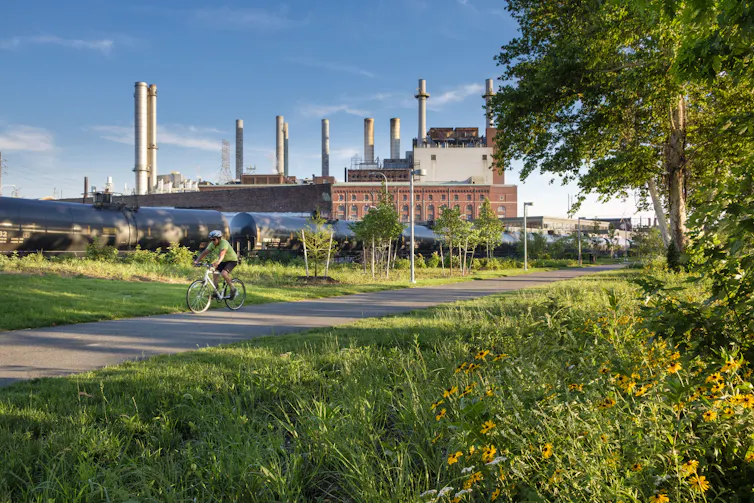
Philly neighborhoods with a higher percentage of green areas, by contrast, have lower levels of diesel particulate matter, nitrogen dioxide and other toxic air pollutants, which inflame and irritate the respiratory system. Many of them have lower asthma rates too.
We are urban and regional planning professors and a graduate research fellow with expertise in environmental planning, environmental health and climate resilience. In 2025 we studied 766 census tracts across nine counties in Pennsylvania and New Jersey that fall within the Philadelphia metropolitan area. This region has a mix of cities, older suburbs and lower-density communities.
We wanted to see how air pollution affects the Philadelphia metro area, how it relates to asthma rates, and whether high-pollution areas overlap with historically redlined neighborhoods. Redlining was a discriminatory practice, formalized in the 1930s by federal agencies, by which banks and insurers marked minority neighborhoods as “high-risk” on maps and denied residents mortgages and other financial services. This cut off investment to these neighborhoods for decades.
To do our analysis, we combined land use and road data from the Delaware Valley Regional Planning Commission, demographic data from the U.S. Census Bureau, asthma estimates from the Centers for Disease Control and Prevention, pollution measures from the U.S. Environmental Protection Agency, and historical redlining maps from the University of Richmond’s Mapping Inequality project.
Among other findings, we were able to rank the tracts with the highest percentages of adults with asthma diagnoses. The top five in order were Franklinville in North Philadelphia, Stanton in North Philadelphia, Bartram Village in southwest Philadelphia, Strawberry Mansion in North Philadelphia and West Chester University in Chester County.
A significant difference in asthma rates between communities is the result of environmental and social pressures that accumulate year after year.
For example, we found that neighborhoods in the Philadelphia metro area with more Black residents and more adults without high school diplomas had higher rates of asthma. These differences remained even after we statistically controlled for measured pollution levels, meaning pollution alone did not explain the gap.
Zoning decisions affect local asthma rates
Greater Philadelphia earned straight Fs for its air pollution in the American Lung Association’s 2026 State of the Air report. The region ranked 17th worst among more than 200 U.S. metropolitan areas for year-round particle pollution.
This means that Philly residents face unhealthy air exposure throughout the year.
Patients, families and physicians often think of asthma as a medical problem. Our findings show that it is also an urban planning problem.
Zoning and infrastructure decisions shape where pollution sources are located and who lives near them. Industrial zoning can mean homes, schools and childcare centers end up close to factories, warehouses and other emission sources. Transportation investments can route highways, truck traffic and freight corridors through particular neighborhoods, which increases residents’ exposure to diesel particulate matter and nitrogen dioxide.
City planning decisions also determine where trees, parks and other green buffers are preserved or added. When industrial activity, heavy traffic and limited green space overlap, residents may face several environmental risks at once. These cumulative burdens are often concentrated in communities that have experienced long-term disinvestment, including limited infrastructure spending, fewer business loans and lower property investment, often rooted in practices such as redlining.
Partially redlined areas fared worse than mostly redlined areas
Redlining maps were available for only four of our nine counties. For a more straightforward comparison, we grouped the four federal Home Owners’ Loan Corporation gradings into two categories: “Favorable” versus “Unfavorable.” We considered the “Best” and “Still Desirable” ratings as “Favorable,” and the “Declining” and “Hazardous” ratings as “Unfavorable.”
Within those counties, asthma rates did not rise steadily as historical grades worsened, which is what we expected to see.
Instead, the highest asthma rates appeared in neighborhoods where “Declining” or “Hazardous” grades covered a middling share of land, rather than in areas that were mostly redlined or mostly favorably graded.
These in-between areas often contained a mix of residential, commercial and industrial uses, and many appear to have changed continuously in the decades since the maps were drawn in 1960s. They may have been especially exposed to later redevelopment, traffic growth, remaining industry and population turnover, as well as uneven reinvestment – where new investment reached some blocks but not others, or brought new burdens such as truck traffic alongside new development.
Our data cannot pinpoint when these changes occurred, only that these areas today carry the heaviest combined exposures.
This finding does not make historical discrimination less important. It suggests that the health consequences of discrimination unfold through decades of subsequent decisions about land use, housing and infrastructure.
A case for studying Kensington and Grays Ferry
Our findings can be used to identify places where asthma risks are concentrated, but they do not explain any one person’s health. Our data could not measure indoor asthma triggers such as mold, pests or poor ventilation, and we lacked information on smoking, occupational exposure to pollutants or irritants, and how much time residents spend outside the neighborhood where they live.
We also could not account for residents’ access to healthcare, including insurance coverage and the availability of nearby providers. These factors affect whether asthma gets diagnosed and treated in the first place.
We observed neighborhoods at a single point in time and did not track how pollution or land use had changed in the years or decades prior. We hope that future studies capture more detailed pollution monitoring and land-use data collected over time.
We would also like to see more research on how traffic, industry, housing and green infrastructure – such as parks, street trees and vacant lots converted to green space – interact to affect residents’ health in mixed-use and redeveloping neighborhoods such as Grays Ferry in South Philadelphia and Kensington in North Philadelphia. Stronger evidence from these areas can help local planning and health agencies choose the right mix of protections and investments for each community.
Read more of our stories about Philadelphia and Pennsylvania, or sign up for our Philadelphia newsletter on Substack.
This article was originally published on The Conversation. Read the original article.