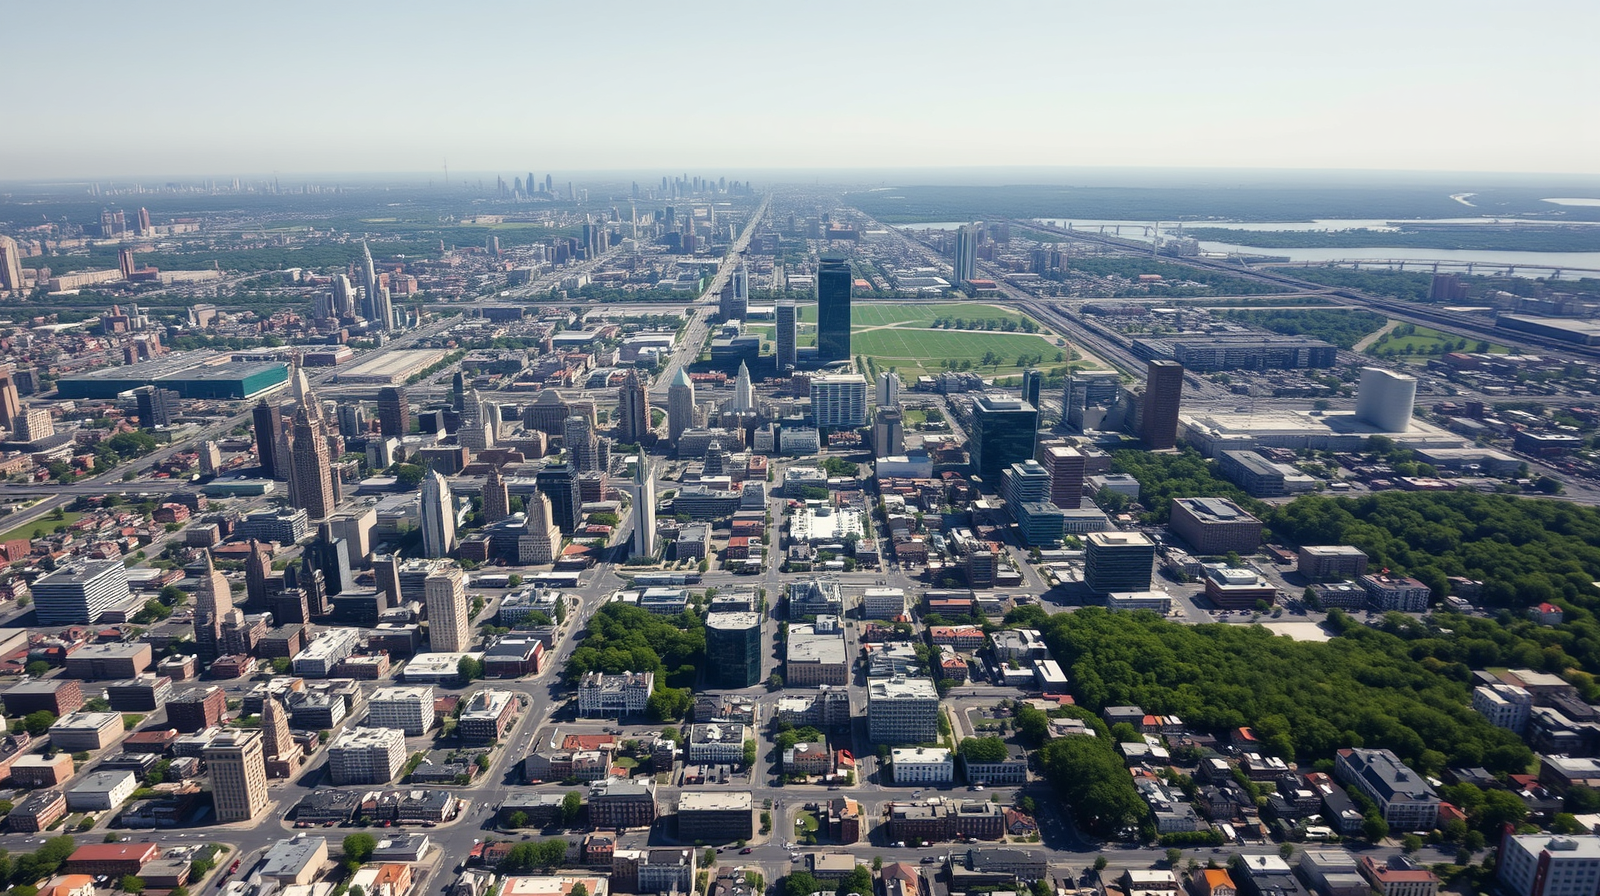
Philadelphia has spent decades trying to become a greener, cooler city, planting trees and expanding parks in neighbourhoods that have historically had the least shade and the highest summer temperatures. Yet when researchers turned to four decades of satellite imagery to actually measure how the city's land cover has changed, the results told a more complicated story than simple, steady greening. Using land cover data stretching from 1970 to 2010, scientists have traced exactly how Philadelphia's tree canopy, buildings and vegetation have shifted over time, and a separate, more recent nationwide analysis has found that the very neighbourhoods running hottest today are often the ones losing greenery fastest, a pattern that carries real consequences for a city already grappling with entrenched heat and environmental inequality. What this decades-long record ultimately confirms is that shade, like so much else in a city, has never been distributed by chance but by choices made long before anyone thought to measure them.
Get breaking news anytime, anywhere. Download the TOI app now!
Why researchers needed four decades of data rather than just a snapshot
Most earlier studies of urban tree canopy change had relied on comparing just two points in time, often only five to ten years apart, offering a limited and sometimes misleading picture of how a city's greenery actually evolves. According to a study published in the journal Landscape and Urban Planning by researchers Dexter Henry Locke, Lara Roman, Jason Henning and Marc Healy of the USDA Forest Service and The Nature Conservancy, this shorter timeframe approach has hindered efforts to understand genuine long term canopy change, since tree cover can turn over considerably within a single decade as some trees are lost while others are newly planted, effectively masking longer running trends. To get around this, the team analysed land cover data spanning five separate categories across a full 40 years for Philadelphia, allowing them to track not just whether canopy grew or shrank overall, but how specific patches of land moved between tree cover, buildings, pavement and vegetation over multiple distinct time periods.
What four decades of change actually revealed
The research found that land cover stability, rather than dramatic transformation, defined most of the city during this period, with stable roads, stable buildings, stable tree canopy and stable herbaceous vegetation together accounting for the overwhelming majority of all observed land cover sequences across the four decades studied. Where change did occur, the researchers found it was closely tied to socioeconomic patterns playing out across different neighbourhoods, with the study noting that other prior research has already established that higher-income areas tend to lose less tree canopy over time while lower-income areas tend to lose considerably more. The Philadelphia-specific analysis reinforced this pattern, finding that tree canopy change and socioeconomic change in the city were closely linked rather than occurring independently of each other.
Why the hottest neighbourhoods keep losing the most shade
A separate and more recent nationwide study has since added fresh urgency to these Philadelphia-specific findings. According to a study published in the journal npj Urban Sustainability , researchers analysing greenery trends across American cities found that 72.7 percent of cities examined are losing their overall greenery, and that areas with the hottest air temperatures within a given city are consistently losing a greater proportion of that greenery than their cooler counterparts. This creates a troubling feedback loop for cities like Philadelphia, the neighbourhoods that most urgently need shade and cooling vegetation to offset dangerous summer heat are, on average, precisely the places where tree cover is disappearing fastest, deepening rather than closing the gap between a city's hottest and coolest districts.
How satellite data is being used to target where trees are needed most
Beyond simply documenting these trends, satellite-based analysis has become a genuinely practical tool for Philadelphia's own public health and planning efforts. According to a NASA DEVELOP National Program report , a NASA-funded research team used Landsat 8 surface reflectance imagery combined with MODIS land surface temperature data to help identify vulnerable populations across Philadelphia disproportionately affected by urban heat and heat-related illness, noting that green spaces and street trees remain unevenly distributed throughout the city in ways that further aggravate heat exposure among the most sensitive residents. This kind of satellite-derived heat mapping has since fed directly into tools like the Philadelphia Department of Health's own publicly available heat vulnerability index, helping city officials target interventions toward the specific blocks and neighbourhoods facing the greatest combined risk from heat and tree cover loss.
Why Philadelphia's history still shapes its canopy today
Much of the inequality visible in this satellite data traces back to decisions made long before anyone was tracking land cover by satellite at all. Philadelphia carries a legacy of redlining, a discriminatory mid-twentieth-century practice that denied investment to specific, often minority, neighbourhoods, and researchers studying the city's urban heat patterns have noted that this history continues to shape uneven green infrastructure distribution and socioeconomic disparities that show up clearly in tree canopy data even today. The city's response has included initiatives like TreePhilly, a municipal programme that has given away and planted thousands of trees across the city, alongside a broader ten-year strategic plan released in 2023 aimed at equitably growing and protecting Philadelphia's urban forest.
What decades of satellite tracking ultimately reveal
Taken together, these overlapping studies paint a picture of a city where tree canopy change is neither random nor purely a matter of weather or chance; it tracks closely with income, historic disinvestment and, increasingly, with which neighbourhoods run hottest during the summer months. The four decades of Landsat-based land cover data compiled by Locke and colleagues offer city planners a genuinely long-term baseline to measure future efforts against, while the more recent national findings on hot neighbourhoods losing greenery fastest underline exactly why continued monitoring matters. For a city actively trying to reverse decades of uneven tree loss, this kind of long-running satellite record offers something increasingly valuable: a clear, data-backed way to see whether today's tree planting efforts are actually reaching the blocks that need them most.