Shares of Palantir Technologies Inc. (NYSE:PLTR) dropped 5% by midday Wednesday, extending Tuesday's sharp 9.4% slide.
- PLTR stock is moving fast. Check live prices here.
The two-day drop marks the stock’s worst back-to-back performance since April—when President Donald Trump's tariff announcement rattled global markets.
But there's something even more unique catching traders’ eyes.
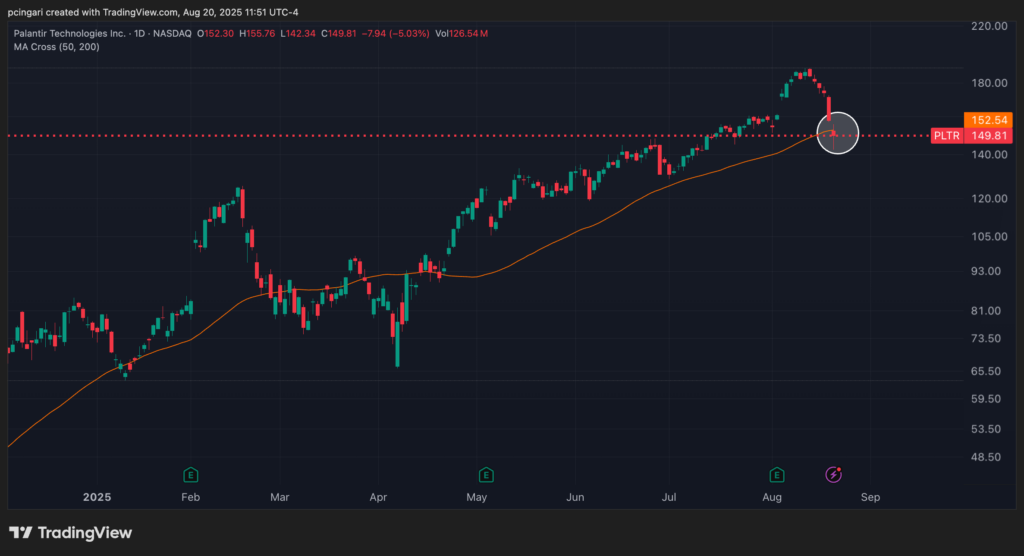
For the first time since spring, Palantir has slipped under its 50-day moving average—a widely watched support line on Wall Street.
History shows that this is not a trivial signal: since its IPO in 2021, there have been 19 occasions when Palantir has broken below this threshold. What followed has often set the tone for months.
Chart: Palantir Sinks Below Key Technical Level
AI Mania Meets Cold Reality
The latest tumble comes as investors begin questioning whether the furious rally in AI-related names has run too far, too fast.
A new paper out of MIT's NANDA initiative, “The GenAI Divide: State of AI in Business 2025,” highlights the gap between hype and execution.
Despite hundreds of billions of dollars being poured into generative AI, only about 5% of pilot programs deliver meaningful revenue growth.
The study, based on 150 executive interviews, 350 employee surveys, and 300 case studies, reveals that most initiatives stall before reaching scale.
This matters for Palantir. Together with Nvidia Corp. (NASDAQ:NVDA), the company has been a poster child for Wall Street's AI boom.
The stock skyrocketed 167% in 2023, an astonishing 340% in 2024, and remained up nearly 100% year-to-date through August 20.
Palantir Sinks Below Key Technical Level—History Shows What Happens Next
The table below highlights all 19 times since 2021 when Palantir broke below its 50-day moving average — and the results might surprise you.
| Date | Start Price | 3M Return | 6M Return | 12M Return |
|---|---|---|---|---|
| 2021-02-17 | 27.99 | -29.5% | -14.6% | -55.7% |
| 2021-07-08 | 22.43 | 6.4% | -27.8% | -55.8% |
| 2021-09-30 | 24.69 | -26.7% | -43.1% | -67.6% |
| 2021-11-10 | 23.60 | -42.8% | -68.0% | -68.4% |
| 2022-04-13 | 12.35 | -25.3% | -37.3% | -31.2% |
| 2022-08-18 | 9.42 | -17.6% | -4.4% | 47.3% |
| 2022-11-07 | 7.78 | 7.1% | -1.8% | 142.4% |
| 2023-03-13 | 7.29 | 121.9% | 114.4% | 238.8% |
| 2023-04-21 | 8.14 | 114.6% | 95.3% | 154.5% |
| 2023-08-10 | 15.44 | 17.6% | 54.9% | 95.7% |
| 2023-10-26 | 15.60 | 5.1% | 41.3% | 188.8% |
| 2023-12-07 | 17.22 | 56.9% | 35.0% | 367.9% |
| 2024-04-04 | 23.82 | 9.2% | 66.5% | 236.1% |
| 2024-05-08 | 21.58 | 25.3% | 157.5% | 420.3% |
| 2024-08-05 | 21.74 | 120.1% | 368.2% | 690.3% |
| 2025-01-14 | 67.18 | 42.6% | 112.4% | N/A |
| 2025-02-28 | 79.98 | 55.3% | N/A | N/A |
| 2025-03-28 | 89.34 | 54.2% | N/A | N/A |
| 2025-04-17 | 94.71 | 60.0% | N/A | N/A |
| Average | 29.2% | 53.0% | 153.6% |
Buy The Palantir Dip—Or Not?
The numbers paint a tale of two eras.
In 2021 and 2022, every time Palantir broke below its 50-day moving average, the stock continued to surge.
We're talking about brutal 6-month or 12-month drawdowns of up to 68%.
With the lone exception of the August 2022 dip, every time Palantir broke below its 50-day moving average during 2021 and 2022 led to extended losses over the following 12 months.
But since early 2023, when the AI-theme began, most technical breakdowns have been followed by outsized rallies, in some cases delivering triple-digit gains within a year.
Across all 19 breakdowns, the average return over 3 months was a solid 29.2%, with nearly three-quarters of the trades ending in the green.
Over 12 months, the average gain balloons to 153.6%, with the best trade started in early August 2024, posting a jaw-dropping 690% return.
That tells us one thing: Palantir's risk-reward profile has shifted dramatically as the AI narrative has taken hold.
So, is this latest drop just another buying opportunity?
If history is any guide, dismissing the dip has been far more costly than buying it—at least in this new chapter of AI-fueled market momentum.
| Period | Average Return | Winning Rate | Best Return | Worst Return |
|---|---|---|---|---|
| 3 Months | 29.2% | 73.7% | 121.9% | -42.8% |
| 6 Months | 53.0% | 56.2% | 368.2% | -68.0% |
| 12 Months | 153.6% | 66.7% | 690.3% | -68.4% |
Now Read:
Image: Shutterstock