Palantir Technologies, Inc (NYSE:PLTR) was surging higher Wednesday in tandem with the S&P 500.
The big-data analytics company has been flying higher in an uptrend, which Benzinga pointed out was likely to continue on July 15.
Palantir’s bullish move on Wednesday also caused the stock to break up from a long-term descending trendline that has been acting as a major resistance zone since Dec. 9, 2021.
A descending trendline acts as a resistance level and indicates there are more sellers than buyers even though the price continues to fall.
For a trendline to be considered valid, the stock or crypto must touch the line on at least three occasions. After that, the more times the trendline is touched, the weaker it becomes.
- Bullish traders can watch for a stock or crypto to break up from the descending trendline and, if the break occurs on high volume, can indicate the downtrend is over and a rally may be on the horizon. It's possible the stock or crypto may fall to back-test the descending trendline as support before heading higher again.
- For bearish traders, “the trend is your friend” (until it’s not), and a touch and rejection of the descending trendline can offer a good short entry. A bearish trader would stop out of this type of trade if the stock or crypto broke above the trendline.
Want direct analysis? Find me in the BZ Pro lounge! Click here for a free trial.
The Palantir Chart: Palantir’s most recent higher low within its uptrend was printed on July 15 at $8.65 and the most recent confirmed higher high was formed at the $10.38 mark on July 8.
On Wednesday, Palantir was appearing to be working its way back up toward the July 8 high-of-day, and if the stock can trade above that level over the coming days, the uptrend is likely to continue.
- If Palantir closes the trading day near its high-of-day price, the stock will print a bullish kicker candlestick, which could indicate higher prices will come again on Thursday. If the stock runs into sellers and closes the day with a long upper wick, Palantir could trade lower over the coming days, which could indicate a tightening pattern may be on the horizon.
- Palantir is trading above the eight-day and 21-day exponential moving averages (EMAs), with the eight-day EMA trending above the 21-day, both of which are bullish indicators. The stock is also trading above the 50-day simple moving average, which indicates longer-term sentiment is bullish.
- Palantir has resistance above at $10.99 and $13.18 and support below at $9.79 and $8.92.
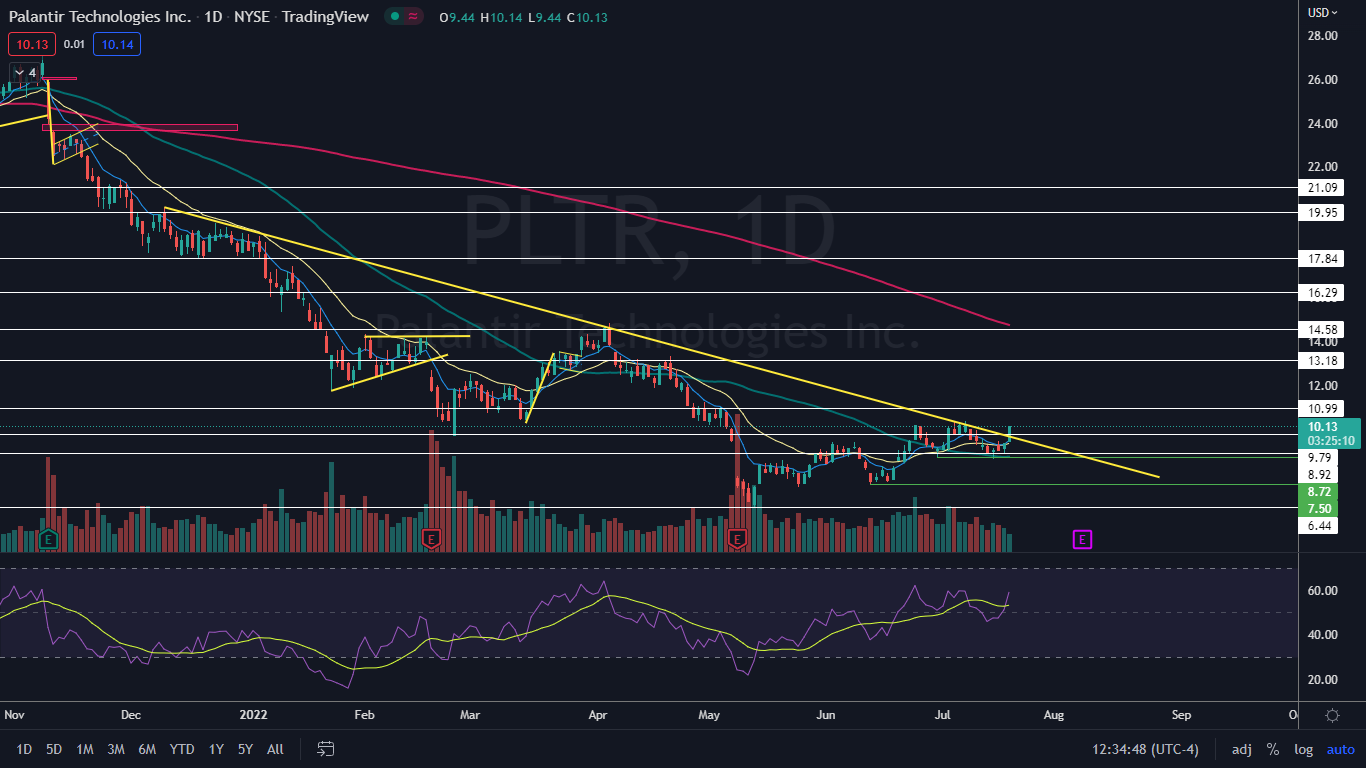
Photo via Shutterstock.