The latest state-of-the-nation water report has some tough lessons for the Government as it embarks on a massive reform of the three waters sector. Here is the problem in 15 charts.
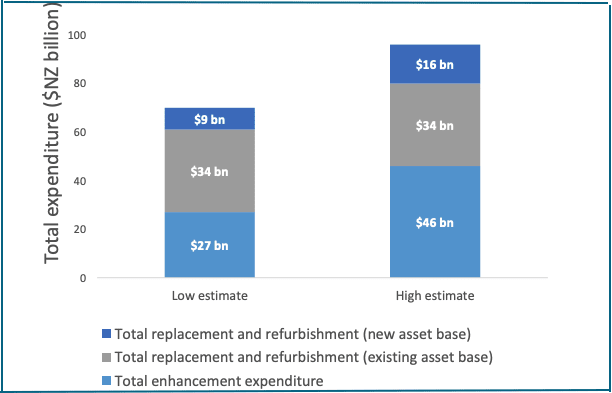
New Zealand’s water problems are serious. The latest Government estimate, from March, is we need to invest between $70 billion and $96 billion over the next 30 years to get our three waters infrastructure (drinking water, sewage/wastewater and stormwater) up to scratch.
And that’s without factoring in population growth or climate change resilience.

“The total investment required once maintenance and renewals are factored in could be in the order of $110 billion over the next 30 to 40 years,” the three waters reform programme document says.
At the moment councils spend $1.5 billion a year - or $45 billion in 30 years.
It’s not enough.
The Government’s ambitious reform programme is being sold as a way to make this massive spend possible - as well as avoid people getting sick from campylobacter in their water, and to prevent geysers disrupting the capital and sewage closing our beaches.
By mid-year, Local Government Minister Nanaia Mahuta and her team should be releasing “substantive policy decisions” around the restructuring programme, with the aim of transitioning to a new way of delivering water by 2022-2023.
We’re at a crucial juncture, and if anyone needed any help to see where the most grunty problems are, Water New Zealand's latest annual benchmark report, the National Performance Review, is a good place to start.
Taking part in the benchmarking process is voluntary for service providers, but 42 of the 66 bodies responsible for supplying and removing our water have provided figures for the just-released survey (July 2019 to June 2020) - representing 89 percent of population supplied.
The report is thorough: it looks at everything from economic performance to sewage/wastewater overflows, from the amount of water leaking out of our pipes, to the shortfall in capital expenditure which is causing it.
As you would expect, the 64 pages contain some grunty charts.
Here are 14 of the best.
It’s a friggin’ big network
We are talking about water assets worth $43 billion, including 88,000 kilometres of drinking, wastewater and stormwater pipes - enough to run up and down the country 55 times. And that's just for the water authorities taking part in the Water NZ survey.
The network supplies four million people in 1.3 million homes and over 100,000 non-residential properties.

We use too much water
Water use in New Zealand is on the rise - up 12 percent between 2016 and 2020, to 504 million cubic metres last year for the survey participants.

Of course, New Zealand's population has also gone up over that same period, but not as much - only 6.5 percent.
Water use is much higher than it needs to be, says Water NZ principal data scientist Lesley Smith, author of the report.
“In the green city of Melbourne, resplendent with trees and gardens, city residents are encouraged to target 155 litres of water use a day. In New Zealand the average is 229 litres per person per day. It is not uncommon for many districts to use another 100 litres on top of that.”
People in Southland use closer to 700 litres of water a day.

In theory, people living in cities like Melbourne or Auckland, where homes all have water meters, use less water than those who live in unmetered cities. You are more likely to turn off the tap when you clean your teeth if you are paying for all that wasted water.
And sometimes it works. The darker the blue band in the table above, the more metering. So it’s not surprising six of the top 10 most thrifty water users are also largely or fully metered.
Or that Southland, where no one is metered, uses the most water per person in the country.
But it’s not as easy as that.
Selwyn district, near Christchurch, is 100 percent metered and is the third most wasteful area in New Zealand. Christchurch, while not as bad as Selwyn, is fully metered and residents still use around 240 litres of water per person per day - compared with Aucklanders, whose average usage would be closer to that magical 155 litre Melbourne figure.
Why? Because as well as metering your residents, you have to charge them enough to make it worthwhile saving water. Christchurch is metered, but everyone still simply pays a fixed annual fee. In Selwyn, there is a per cubic metre component, but it’s tiny - around 50 cents, as compared to $2 in Hamilton and more than $4.20 in Auckland, including a pro rata-ed wastewater volume charge.
Just under half of New Zealanders and 21 service providers don’t have residential water meters in place, the report says.
A fifth of our water leaks away
Consider this: ratepayers like you and me fork out our hard-earned dollars for water authorities to collect and treat drinkable water - an increasingly precious resource. And then 21 percent of it leaks away before it even gets to our taps.
And it's getting worse.
In 2014, Water NZ estimated 149 litres of water was being lost per property per day. Now it’s almost 215 litres - a 44 percent increase.

The global gold standard internationally for measuring water loss is the infrastructure leakage index.
There are eight performance bands in the index and worryingly, of the 30 New Zealand water authorities measured, only five are doing well. A further 18 could do better, three are really awful, and four are at various levels of abysmal.

Just to put the bands in perspective, Wellington Water, with its geysers and flooded streets, isn’t by any means the worst performer. It falls into the “possibilities for further improvement” category. There are 17 other water authorities in that same category - presumably the leaks are less visible or the inhabitants less vocal. And there are seven water authorities which lose more water than Wellington - some considerably more.
Too many pipes are stuffed
Given the level of leaks, it should perhaps not be a surprise how little information some water authorities have about the state of repair of their pipe networks. Four water authorities haven't looked at any of their water supply pipes and nine have assessed the condition of less than half.

And when they do know, it turns out lots of those water pipes are in a poor or a very poor condition, and even then the quality of much of the data ranges from "less reliable" (a 3 on the graph below) to "highly uncertain" (a 5). Only four of the 39 bodies that took part in the benchmarking think their data is "highly reliable".

It's a similar story for wastewater and stormwater.
Sewerage overflows go unmonitored
“When untreated sewage spills, discharges or otherwise escapes from the wastewater network to the external environment, this is referred to as a wastewater overflow,” says the Water NZ performance review.
So-called ‘dry weather’ overflows can be caused by blockages - fat, oil or wet wipes in the pipes, for example. Others are caused by tree roots, old pipes collapsing, or by plant failures. Last year there were almost 2000 of these dry weather incidents.
Wet weather overflows happen during storms, when rain leaks into the sewerage network (through broken pipes, for example) and overloads it.
Sometimes the sewage-containing wastewater is syphoned off into the stormwater network, but often it ends up in streams, rivers or the ocean. Other times it spills out of manholes and gully traps onto roads, into gardens, or even people’s houses.
The National Performance Review graph below appears to show that wet weather sewage/wastewater overflows have decreased over the past couple of years.

But the report notes show that isn’t the real story at all. The actual situation is that Auckland has so many problems with sewerage overflows it just can’t monitor them all.
“In Auckland the very high frequency of combined sewer overflow operation in wet weather presents a significant challenge in terms of reporting,” Auckland’s Watercare says, adding it is implementing a range of initiatives to resolve the problem.
“Against this, the complexity of the system and the sheer number of sites, many of which are very difficult to accurately monitor, makes reporting unreliable.”
There is similar uncertainty at a national level about just how often sewage and wastewater is overflowing into our streets and our waterways.
Different water authorities use different monitoring systems. More than half the water service providers in the study rely completely on ‘verbal reports’ - someone letting them know there is sewage/wastewater pouring out - or so-called SCADA (supervisory control and data acquisition) monitoring systems.
The trouble is, as the report’s authors say, “Wastewater overflows tend to be under-reported when based on verbal reports or SCADA monitoring." For example, people aren't likely to notice or report a wastewater overflows which happens overnight. And SCADA systems won't capture uncontrolled wet weather overflow events occurring at unmonitored points in the network.
As this chart shows, the more sophisticated a monitoring system is, the less likely it is to be used by water service providers

The New Zealand Wastewater Sector report, commissioned by the Ministry for the Environment from engineering and planning companies Beca, GHD, and Boffa Miskell, says the lack of knowledge and monitoring and the wide range of approaches to regulation of wastewater overflows mean even the most basic regional benchmarking and performance improvement metrics are impossible.
“Consistency in approach across all these areas would lead to considerable benefits,” the report team said.
“Councils have varying degrees of knowledge of their wastewater networks including where their overflows occur (uncontrolled) and what events trigger them.
“There are a number of councils that do not currently hold sufficient detailed knowledge of their networks to predict where overflows currently occur.”
Two of the water authorities reporting to the Water NZ survey admit to having no overflow tracking in place at all.
Wastewater treatment plants break the rules
Meanwhile there seems to be a big problem of wastewater treatment plants breaking the rules - discharging contaminated water, for example, or operating without a resource consent - and getting away with it.
In 2019, there were 629 incidents of “non-conformance” and in only 11 cases did anyone do anything about it.
As the table below shows, that improved a bit in 2020. Enforcement actions went up to 29 and reported non compliance incidents fell to 397.
Still, it’s a massive difference.

In 2019, the Department of Internal Affairs commissioned the National Stocktake of Municipal Wastewater Treatment Plants from consultants GHD and Boffa Miskell.
The results were shocking.
For example, of 170 wastewater treatment plants the team looked at, only a quarter (27 percent) achieved full compliance, 26 percent had low risk non-compliance, 22 percent had moderate non-compliance and a full quarter (25 percent) had significant non-compliance.
Meanwhile, nearly a quarter of plants (73 in total) were operating on expired consents, with the average time operating on an expired consent being four years, the report found.
Monitoring of water quality and contaminants in discharges was sometimes chaotic and varied widely from one plant to another.
For example, often a resource consent approval would list contaminants that shouldn’t be released into the water, but without putting a numerical value on what was acceptable and what wasn’t.
So it was virtually impossible for regulators to take action.
Another problem was that taking a strong line against treatment plants polluting water sources was often a political no-no, the GHD-Boffa Miskell report said.
“WWTPs are typically operated by territorial local authorities with the regional councils acting as the primary enforcement agencies (most unitary authorities perform both roles in tandem). The result of this is that councils can face pressure from ratepayers who object to being required to finance both prosecution and defence.”
Water: Sucking up money
Water systems are expensive to build and maintain - and it’s going to get worse. Ageing networks, tougher rules (or at least stricter enforcement of those rules), population growth and the future impacts of climate change - that’s all going to need a lot of money.
Capital expenditure on water and wastewater services for the providers covered by the Water NZ report increased significantly in the 2020 fiscal year, boosted in particular by sharp rises in Auckland - one of the first networks to take on board the seriousness of the problem. Watercare spent $192 million for water supply last year, up from $148 million, and wastewater spend went from $279 million to $391 million.

Still, the data suggests the amount of money being spent on asset renewal in water networks is falling short of what needs to be spent on failed and failing infrastructure.
The critical number is depreciation, an accounting term representing the amount by which the value of different parts of the network - pipes, plants, reservoirs etc - are decreasing over time because of wear and tear or obsolescence.
By law, water authorities have to collect enough money each year to cover the depreciation of their assets - so at some point they can repair or replace them.
But over the years most councils have spent far less on water infrastructure than they have collected to cover depreciation.
That decision is now coming back to bite them.
For more on the dark art of depreciation in water networks read Newsroom’s story ‘Wellington water chaos a warning for all’.

There are skills shortages
So there’s a massive amount to be done, but who’s going to actually carry out all this water infrastructure work? And do these people have the skills to do a good job?
To be a plumber, you need training and qualifications. But to work in water infrastructure you mostly don’t. And that’s a problem.
Nearly 60 percent of water service provider employees have no qualifications - or at least none their bosses know about. Less than 10 percent are enrolled in continuing professional development.

“The lack of information on staff training and qualifications is quite surprising and, possibly, quite concerning,” an AECOM verification audit of the report said. “Going forward, the thought is that the regulator will be looking for assurances that the industry is employing the right people with suitable qualifications and training, and a commitment to staying up to date with the latest technologies.”
Meanwhile, vacancy levels for people building and maintaining our water infrastructure are stubbornly high. Eight percent of roles are waiting to be filled, which is a worry as the sector faces a massive backlog of maintenance and upgrade work.
“The workforce is struggling to keep up with existing levels of growth, despite a 25 percent increase in the number of people employed in the last year,” Water NZ chief executive Gillian Blythe says.
“Only 77 percent of budgeted capital expenditure was spent last financial year, and the lack of people to deliver projects is widely acknowledged as a key reason for that gap.

Missed opportunities
Sewage sludge, the solid fraction of treated wastewater leaving sewage treatment plants, is not the most sexy of products, which is why it is often euphemistically called biosolids. But it can be super-useful - energy dense and a great source of nutrients for plants. In New Plymouth, a 'bioboost' product is used to fertilise golf courses, in the Bay of Plenty sludge is the main feedstock for industrial scale worm farms. Meanwhile, biosolids from the country's biggest treatment plant, at Mangere in Auckland, are being used to rehabilitate land at the Puketutu Island regional park.
Still, lots of sewage goes to waste, so to speak. Worse, the usual disposal method is to pay to send it to landfill.

The National Performance Review also promotes using wastewater to produce energy.
"It is a little known fact our wastewater contains over 10 times the energy used to treat it," Water NZ's Lesley Smith says. Treatment plants in Auckland, Whangarei, Hamilton, Palmerston North and Christchurch have already begun to tap into this resource, she says, producing more than 250 gigajoules of energy last year. But that means the rest - more than 200 treatment plants - aren't.
"The opportunities are enormous."