
Gold’s rally has captured headlines, but even in the strongest uptrend, there typically comes a mean reversion at some point. Recently, the Market on Close team flagged overbought conditions in gold and reminded viewers that 5–10% corrections are healthy resets before the next leg up.
During last Friday’s Market on Close livestream, John Rowland followed up by calling out a rare bearish candlestick for traders to watch, and highlighted the key technical levels for gold going forward.
“This is looking like a very dominant reversal pattern… [but] in a bearish kicker when you get the second candle, you usually get follow-through over the next 2–3 days,” John said.
As John explained, context is key, and the bearish candle pattern can be negated if the price is able to recapture and close above 50% of the bearish kicker – which gold (GCZ25) has done, with simmering geopolitical tensions keeping a strong bid at the precious metal’s back so far this week.
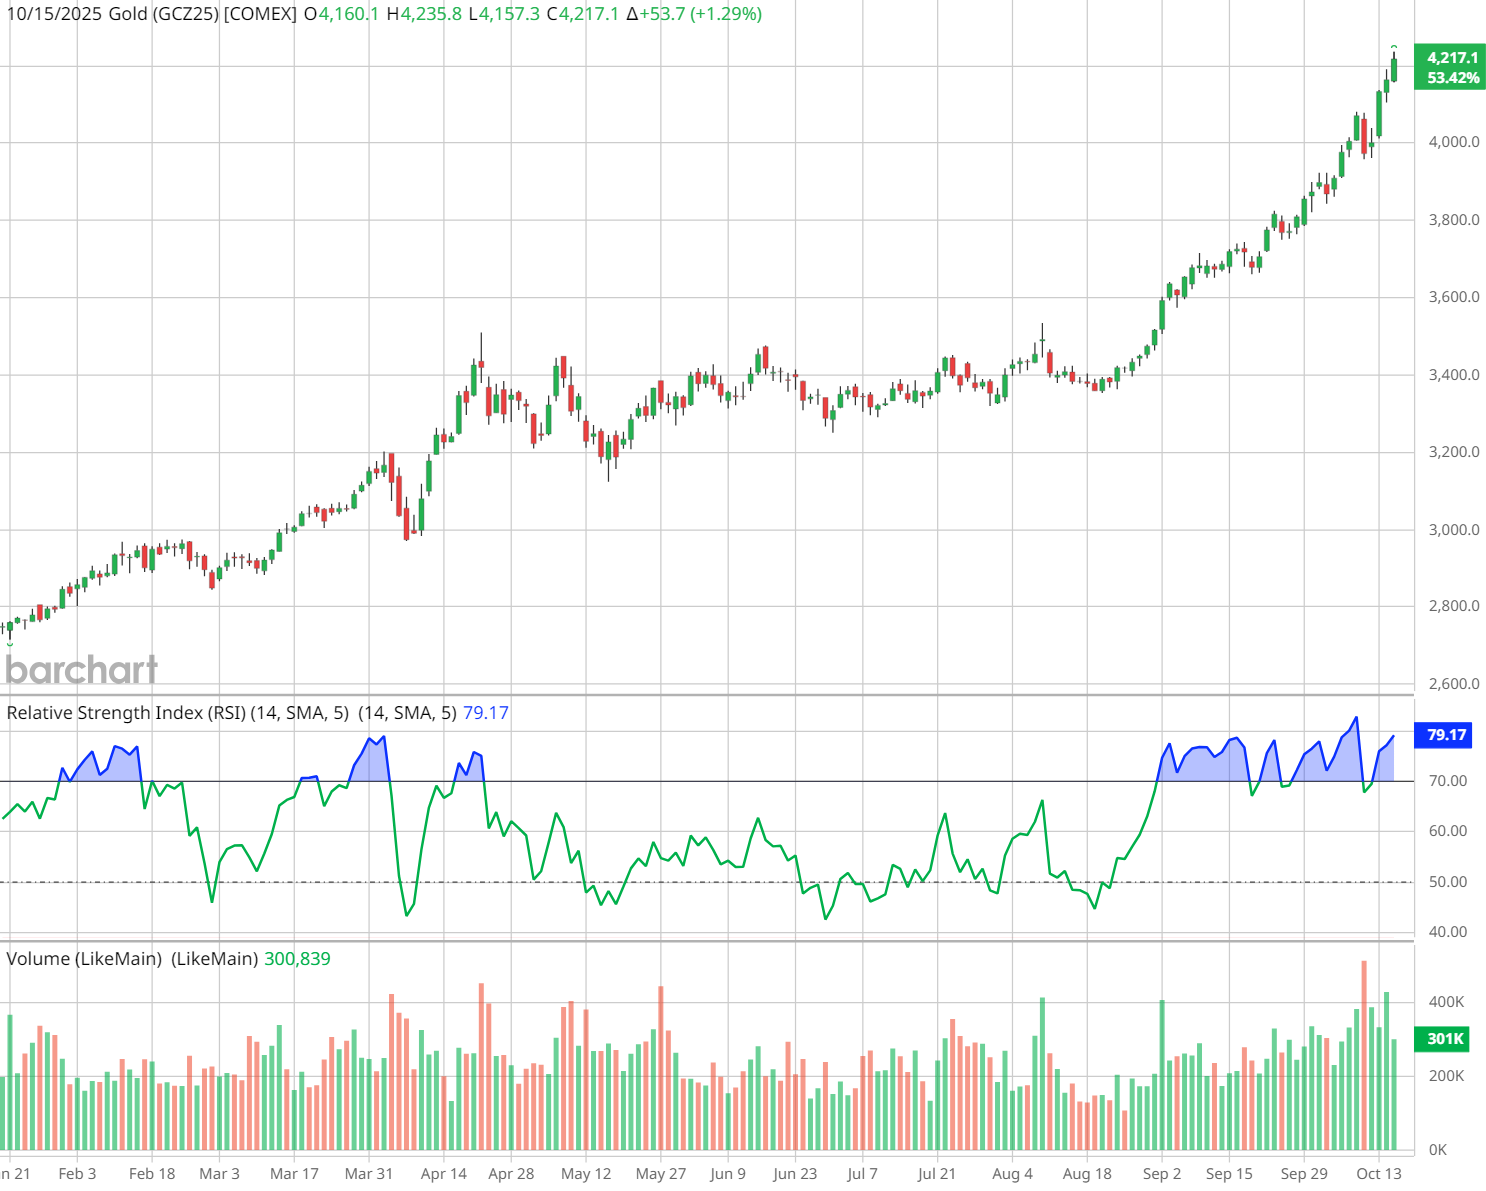
In fact, instead of pulling back, the precious metal closed Tuesday at $4,164, one of the Fibonacci extension levels John called out during Friday’s live session.
But no asset moves in a straight line higher forever… right? For investors who have been impatiently awaiting a pullback in gold futures, here’s what our Senior Market Strategist is watching now, and the notable price points to watch on both sides of the trade.
John’s Critical Price Levels, and His New Warning on Technicals
John noted a mean reversion zone down near $3,850 as a potential target for a pullback.
On the flip side, $4,277.50 is the next Fibonacci extension level to watch on a continued rally. Traders should keep an eye on how gold reacts to new highs, and whether reversal candles form near peaks
As of today, our Senior Market Strategist is wary of trading gold actively from either side, though:
“At this point, gold is exhibiting behavior that is at odds with traditional technical indicators and may be indicative of something more significant, such as a loss of faith in the U.S. government, its debt, and the dollar,” John says. “From my perspective, I can't buy it, I'm not going to sell it, and it might take time before it starts to behave like gold, steady and stoic.”
What does that mean for investors?
“If you are in the trade and sitting on a lot of gains, it might be a good time to reallocate and diversify into other precious metals, such as silver, platinum, and palladium,” notes John, which are all well-represented in the abrdn Physical Precious Metals Basket Shares ETF (GLTR).
What’s Driving Gold & What Could Trigger Pullbacks
Bullish drivers (that may help gold resist a sharp drop):
- Central bank gold accumulation and reserve diversification
- Weakening real yields and expectations of further Fed rate cuts
- Ongoing geopolitical risks and inflation uncertainty
Catalysts for a potential pullback:
- The RSI recently hit historic overbought levels, and extremes tend to invite profit-taking
- Monetary policy surprises: hawkish commentary or weaker-than-expected inflation data
- Strength in the U.S. dollar ($DXY) or rising real yields — making non-yielding gold less attractive
- Technical resistance zones or reversal candles clustering near highs
Tools to Use on Barchart
To trade or monitor this setup yourself, use these Barchart tools:
- Trader’s Cheat Sheet for Gold — for technical pivots and standard deviation support/resistance zones
- Interactive Gold Charts (GLD / GC*1) — add RSI, spot candlestick patterns, and analyze recent reversal bars
- GLD Put/Call Ratio — see how options traders are positioning on gold
- Seasonal Returns — compare historic pullbacks and overbought cycles
The Takeaway
Gold may still have momentum, but we’re in a zone where euphoric extension invites corrections. John’s technical analysis offers a roadmap for where that correction could land.
And if gold rolls over, it’s not necessarily the end of the bull run; it may just be a reset. The key is to watch how it behaves at those levels, and whether the reversal candle structures confirm.
Watch the quick breakdown on gold →