I'm not too big on saccharine aphorisms but legendary investor's Warren Buffett's time-tested advice comes to mind during Tuesday's market selloff: "Be fearful when others are greedy, and greedy when others are fearful." Of course, the problem with such sentiments is that it's empirically impossible to determine which stocks to buy when they're supposedly on a discount. Drilling into the details, though, tech juggernaut Alphabet Inc (NASDAQ:GOOG, NASDAQ:GOOGL) makes a compelling case for itself.
On a year-to-date basis, Class C GOOG stock hasn't been the strongest performer, gaining around 6%. However, like other publicly traded innovators, GOOG (along with Class A GOOGL) has popped dramatically higher since the April lows. It has marched convincingly higher until recently, when forward momentum appeared to wane. On Tuesday early afternoon, the security was down more than 1%.
It could be a case of investors simply taking some profits off the table. Last month, Alphabet posted strong second-quarter results, with revenue hitting $96.43 billion, beating the consensus target of $93.72 billion. On the bottom line, the company posted earnings of $2.31 per share, exceeding the consensus view of $2.16 per share.
Notably, management raised its capital expenditure outlook for 2025 to approximately $85 billion, citing "strong and growing demand" for cloud products and services. With arguably more positives than negatives, investors may have simply secured some of their gains — especially amid an uncertain macro environment.
Technical analysts will likely point to GOOG stock potentially forming a head-and-shoulders pattern. As one of the most commonly cited patterns in the discipline, it attracts attention from both retail and professional traders. Symbolically, it suggests that the bulls are running out of steam — and eventually, the bears take over.
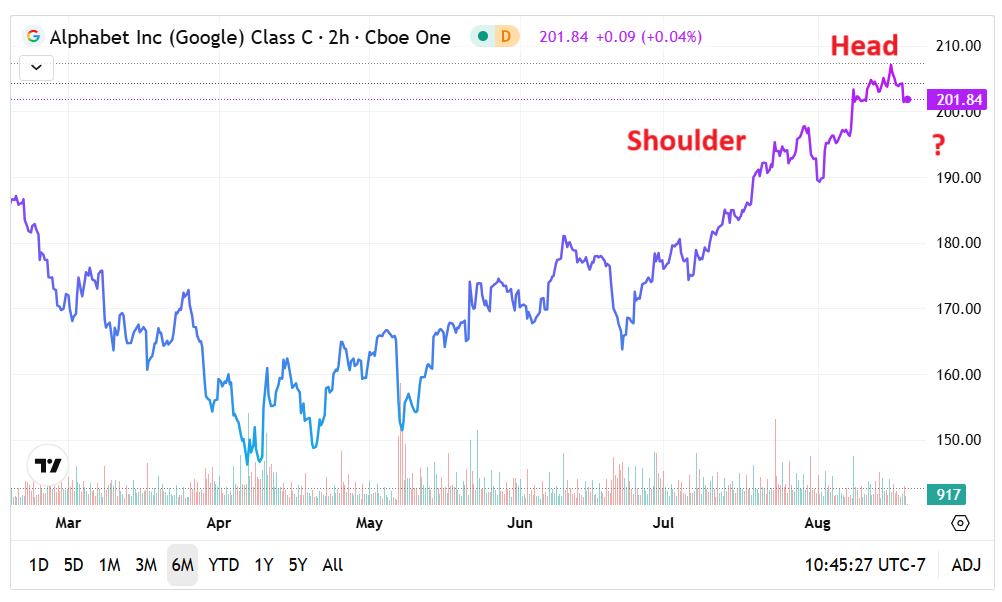
Still, one of the issues with technical analysis is that such patterns are usually only meaningful in retrospect. If GOOG stock changes its trajectory, the signal may simply vanish. Either way, belief in the head and shoulders requires confirmation — and waiting for this confirmation could nullify the empirical approach that just materialized today.
GOOG Stock Offers A Statistically Tempting Proposition
To be fair, traders with a bearish framework have evidence to back up their anxieties. Concerns that tariffs may negatively impact the otherwise robust tech sector have startled Wall Street. As such, market pros are loading up on bearish options — specifically far out-the-money puts. Essentially, such acquisitions may represent insurance against a potential meltdown (since they pay out if the targeted assets reach negative profitability thresholds).
At the same time, it's important to note that a day earlier, the bulls were celebrating the tightening spread between U.S. investment-grade corporate bonds and Treasury yields. This rare bond market signal hasn't been seen since 1998 — right before one of the most explosive bull markets in U.S. history.
These examples highlight the reality that trading on the headlines is extremely difficult: opinions are flying left and right. Just about the only objective truth you can hold on to is this: at the end of the day, the market is either a net buyer or net seller.
My presupposition is that the series of market behaviors in the recent past reflect heaviest on investor sentiment in the future. By tracking Wall Street's sentiment voting record on a discrete, binary basis, we can more easily identify patterns — objective, falsifiable ones — for the purpose of extracting probabilistic analysis.
For example, in the past 10 weeks, the market voted to buy GOOG stock six times and sell four times. During this period, GOOG saw an upward trajectory. For brevity, we can label this sequence as 6-4-U. What's notable here is that, in 64.18% of cases, the following week's price action results in upside, with a median return of 1.94%.
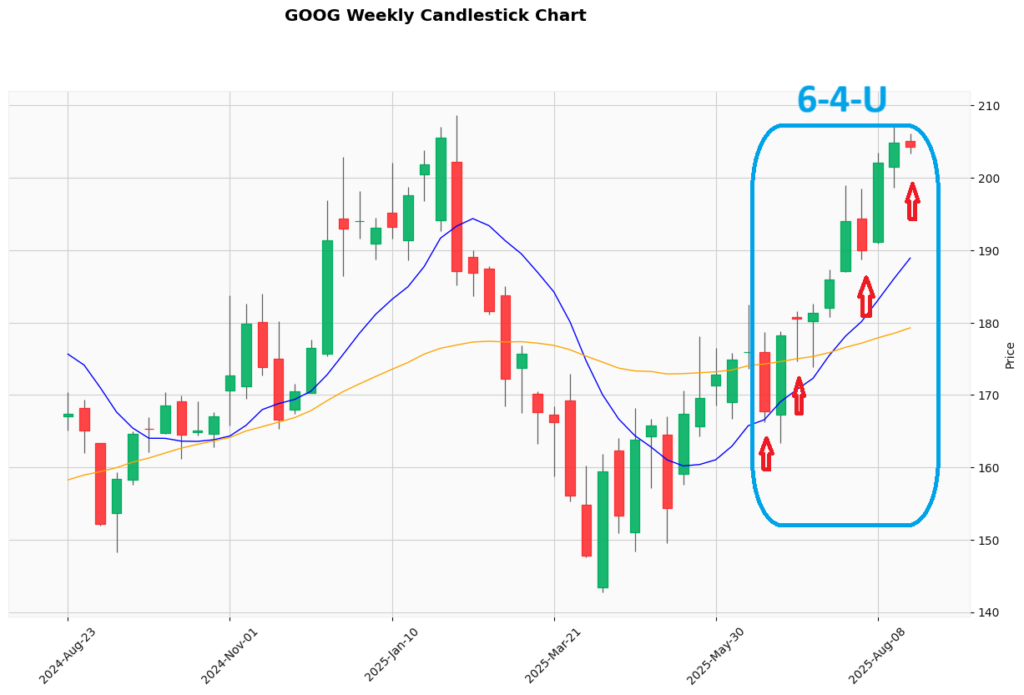
Obviously, it's important that any trading proposition on paper must beat the baseline performance; in this case, the chance that a long position in GOOG stock will rise on any given week. This metric stands at a lofty 57.64%, which is a strong upward bias.
Despite this steep benchmark, the 6-4-U statistically gives bullish traders an edge. Therefore, speculators may be justified in taking a shot here.
Taking What Jittery Market Makers Are Willing To Give
If you believe in the empirical case over the technical, there are two multi-leg options strategies that stand out. Both are bull call spreads, which involve buying a call and simultaneously selling a call at a higher strike price. The net debit (long debit minus short credit) paid also doubles as the most you can lose in the trade. Of course, the idea is that the target security rises through the short (higher) strike price at expiration to collect the maximum payout.
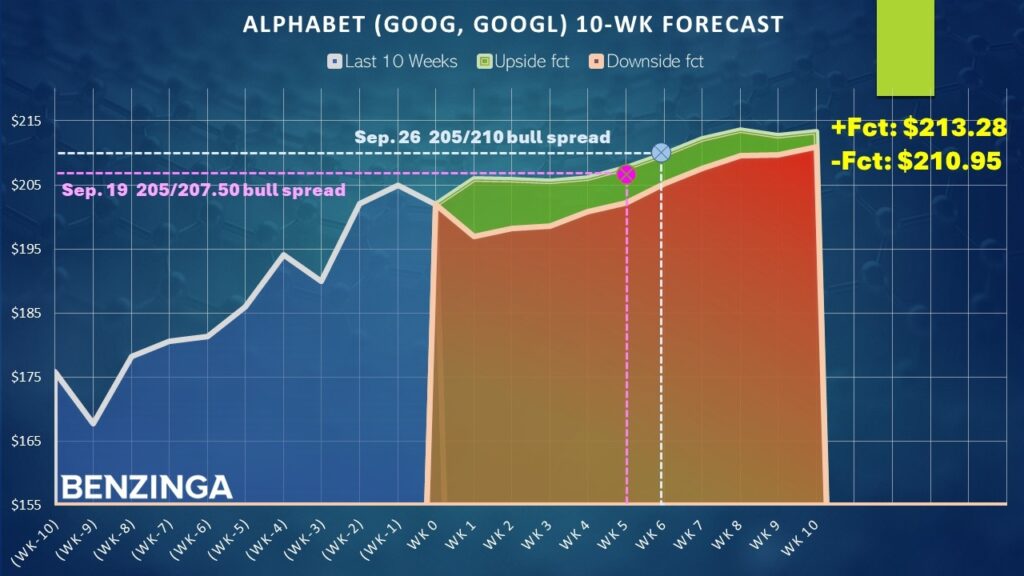
First, bullish traders may consider the 205.00/207.50 bull spread expiring Sept. 19. This transaction requires a net debit of $115, with a maximum profit of $135 or a payout of over 117%. Second, speculators may consider the 205/210 bull spread expiring Sep. 26. This transaction requires a net debit of $210, for the chance to generate a profit of $290, a payout of more than 138%.
Both call spreads are intriguing, with the main difference being that the Sep. 26 spread requires more money upfront in exchange for an additional time buffer.
In terms of the statistical viability of the 6-4-U sequence, running a one-tailed binomial test reveals a p-value of 0.1686. Basically, this means that there's a 16.86% chance that the implications of the signal could materialize randomly as opposed to intentionally.
While it's a little bit more challenging to distinguish the 6-4-U's signal from randomness, the higher p-value stems from GOOG stock enjoying a super-high baseline probability. Ultimately, that should inspire confidence for bullish traders as the bears really need a convincing argument to move against this tide.
The opinions and views expressed in this content are those of the individual author and do not necessarily reflect the views of Benzinga. Benzinga is not responsible for the accuracy or reliability of any information provided herein. This content is for informational purposes only and should not be misconstrued as investment advice or a recommendation to buy or sell any security. Readers are asked not to rely on the opinions or information herein, and encouraged to do their own due diligence before making investing decisions.
Read More:
Image: Shutterstock